We continue to develop the algorithms for FinAgent, a multimodal financial trading agent designed to analyze multimodal market dynamics data and historical trading patterns.
In this article, we will start creating the C_Orders class to be able to send orders to the trading server. We'll do this little by little, as our goal is to explain in detail how this will happen through the messaging system.
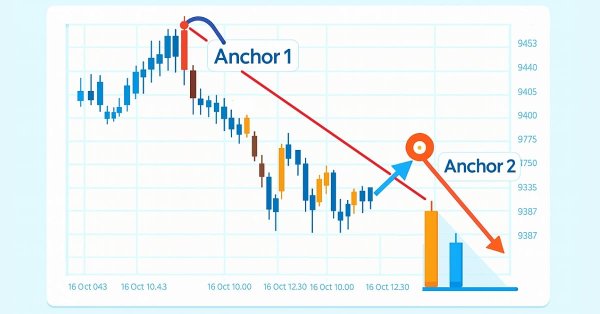
This article explains how to build an Expert Advisor (EA) that interacts with chart objects, particularly trend lines, to identify and trade breakout and reversal opportunities. You will learn how the EA confirms valid signals, manages trade frequency, and maintains consistency with user-selected strategies.
We invite you to explore FinAgent, a multimodal financial trading agent framework designed to analyze various types of data reflecting market dynamics and historical trading patterns.
This article introduces a fully automated MQL5 system designed to identify and trade market swings with precision. Unlike traditional fixed-bar swing indicators, this system adapts dynamically to evolving price structure—detecting swing highs and swing lows in real time to capture directional opportunities as they form.
The original Royal Flush Optimization algorithm offers a new approach to solving optimization problems, replacing the classic binary coding of genetic algorithms with a sector-based approach inspired by poker principles. RFO demonstrates how simplifying basic principles can lead to an efficient and practical optimization method. The article presents a detailed analysis of the algorithm and test results.
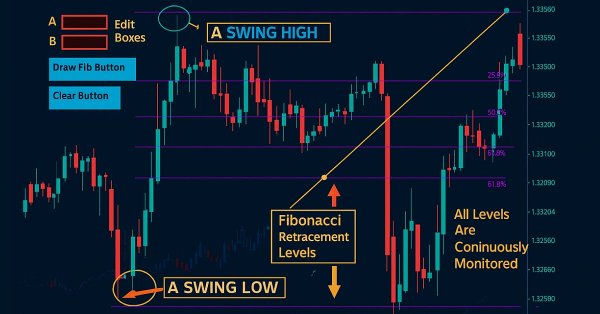
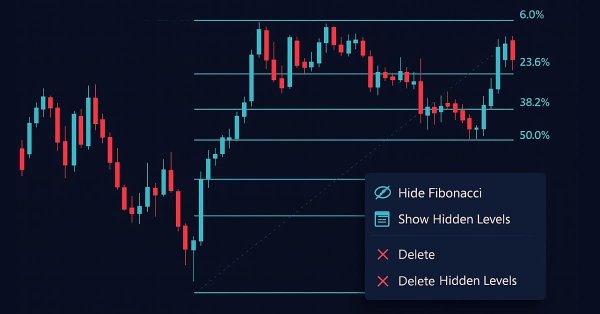
Fibonacci tools are among the most popular instruments used by technical analysts. In this article, we’ll build an Interactive Fibonacci EA that draws retracement and extension levels that react dynamically to price movement, delivering real‑time alerts, stylish lines, and a scrolling news‑style headline. Another key advantage of this EA is flexibility; you can manually type the high (A) and low (B) swing values directly on the chart, giving you exact control over the market range you want to analyze.
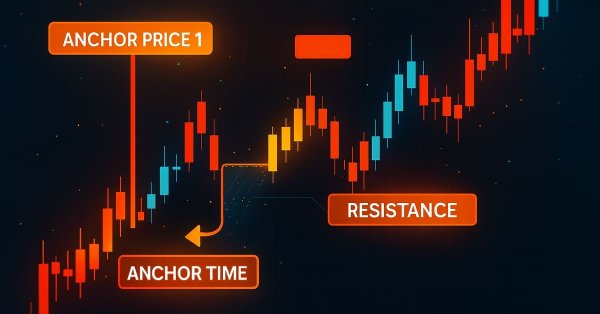
This article teaches you how to create an Expert Advisor that detects support and resistance zones drawn on the chart and executes trades automatically based on them.
We continue our work on creating the FinMem framework, which uses layered memory approaches that mimic human cognitive processes. This allows the model not only to effectively process complex financial data but also to adapt to new signals, significantly improving the accuracy and effectiveness of investment decisions in dynamically changing markets.
The article introduces the dialectical algorithm (DA), a new global optimization method inspired by the philosophical concept of dialectics. The algorithm exploits a unique division of the population into speculative and practical thinkers. Testing shows impressive performance of up to 98% on low-dimensional problems and overall efficiency of 57.95%. The article explains these metrics and presents a detailed description of the algorithm and the results of experiments on different types of functions.
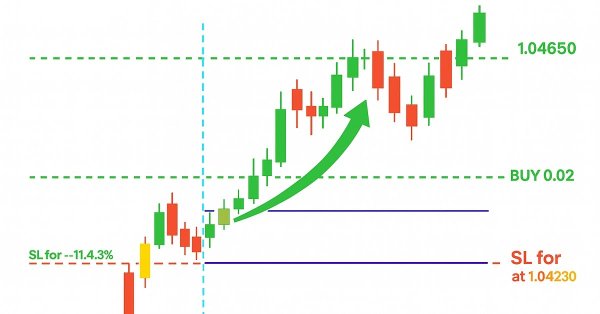
For many traders, it's a familiar pain point: watching a trade come within a whisker of your profit target, only to reverse and hit your stop-loss. Or worse, seeing a trailing stop close you out at breakeven before the market surges toward your original target. This article focuses on using multiple entries at different Reward-to-Risk Ratios to systematically secure gains and reduce overall risk exposure.
The Stochastic Oscillator and the Fractal Adaptive Moving Average are an indicator pairing that could be used for their ability to compliment each other within an MQL5 Expert Advisor. We introduced this pairing in the last article, and now look to wrap up by considering its 5 last signal patterns. In exploring this, as always, we use the MQL5 wizard to build and test out their potential.
Trading strategies may be challenging to improve because we often don’t fully understand what the strategy is doing wrong. In this discussion, we introduce linear system identification, a branch of control theory. Linear feedback systems can learn from data to identify a system’s errors and guide its behavior toward intended outcomes. While these methods may not provide fully interpretable explanations, they are far more valuable than having no control system at all. Let’s explore linear system identification and observe how it may help us as algorithmic traders to maintain control over our trading applications.
In this article, we'll cover the basics of risk management in trading and learn how to create your first functions for calculating the appropriate lot size for a trade, as well as a stop-loss. Additionally, we will go into detail about how these features work, explaining each step. Our goal is to provide a clear understanding of how to apply these concepts in automated trading. Finally, we will put everything into practice by creating a simple script with an include file.
This article explores how to build an Opening Range Breakout (ORB) Expert Advisor in MQL5. It explains how the EA identifies breakouts from the market’s initial range and opens trades accordingly. You’ll also learn how to control the number of positions opened and set a specific cutoff time to stop trading automatically.
The Stochastic Oscillator and the Fractal Adaptive Moving Average are another indicator pairing that could be used for their ability to compliment each other within an MQL5 Expert Advisor. We look at the Stochastic for its ability to pinpoint momentum shifts, while the FrAMA is used to provide confirmation of the prevailing trends. In exploring this indicator pairing, as always, we use the MQL5 wizard to build and test out their potential.
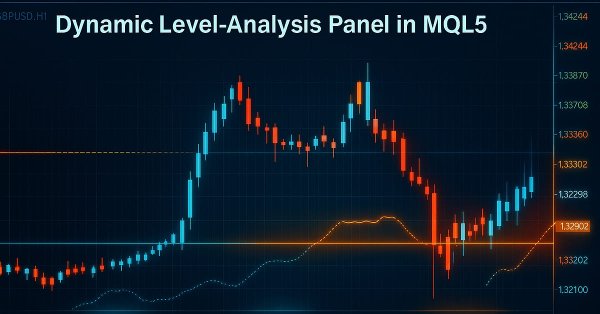
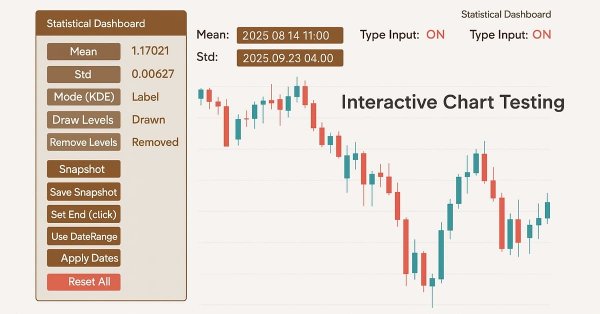
In this article, we explore a powerful MQL5 tool that let's you test any price level you desire with just one click. Simply enter your chosen level and press analyze, the EA instantly scans historical data, highlights every touch and breakout on the chart, and displays statistics in a clean, organized dashboard. You'll see exactly how often price respected or broke through your level, and whether it behaved more like support or resistance. Continue reading to explore the detailed procedure.
Layered memory approaches that mimic human cognitive processes enable the processing of complex financial data and adaptation to new signals, thereby improving the effectiveness of investment decisions in dynamic markets.
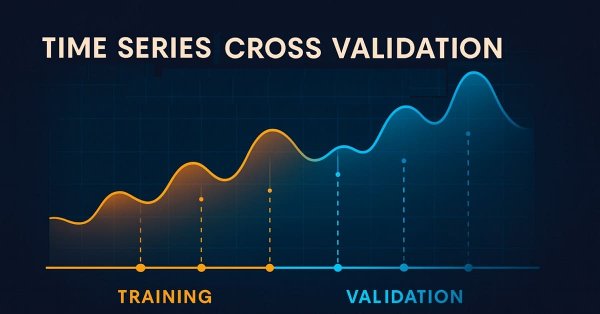
In this series of articles, we look at the challenges faced by algorithmic traders when deploying machine-learning-powered trading strategies. Some challenges within our community remain unseen because they demand deeper technical understanding. Today’s discussion acts as a springboard toward examining the blind spots of cross-validation in machine learning. Although often treated as routine, this step can easily produce misleading or suboptimal results if handled carelessly. This article briefly revisits the essentials of time series cross-validation to prepare us for more in-depth insight into its hidden blind spots.
In this article, we explore how previously invalidated orderblocks can be reused as mitigation blocks within Smart Money Concepts (SMC). These zones reveal where institutional traders re-enter the market after a failed orderblock, providing high-probability areas for trade continuation in the dominant trend.
This article introduces a VWMA crossover signal tool for MetaTrader 5, designed to help traders identify potential bullish and bearish reversals by combining price action with trading volume. The EA generates clear buy and sell signals directly on the chart, features an informative panel, and allows for full user customization, making it a practical addition to your trading strategy.
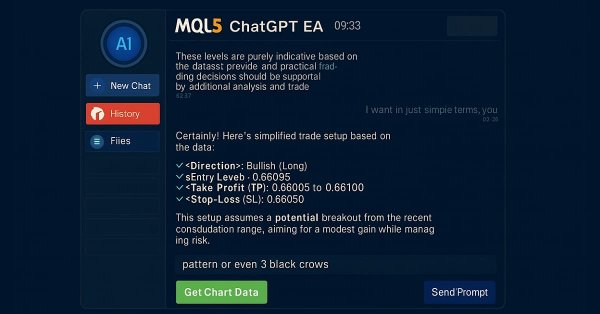
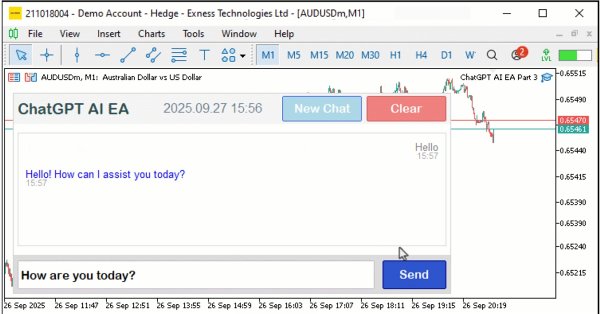
In this article, we enhance the ChatGPT-integrated program in MQL5 overcoming multiline input limitations with improved text rendering, introducing a sidebar for navigating persistent chat storage using AES256 encryption and ZIP compression, and generating initial trade signals through chart data integration.
In the previous article, we explored the theoretical foundations and began implementing the approaches of the Multitask-Stockformer framework, which combines the wavelet transform and the Self-Attention multitask model. We continue to implement the algorithms of this framework and evaluate their effectiveness on real historical data.
Many traders have experienced this situation, often stick to their entry criteria but struggle with trade management. Even with the right setups, emotional decision-making—such as panic exits before trades reach their take-profit or stop-loss levels—can lead to a declining equity curve. How can traders overcome this issue and improve their results? This article will address these questions by examining random win-rates and demonstrating, through Monte Carlo simulation, how traders can refine their strategies by taking profits at reasonable levels before the original target is reached.
We invite you to explore a framework that combines wavelet transforms and a multi-task self-attention model, aimed at improving the responsiveness and accuracy of forecasting in volatile market conditions. The wavelet transform allows asset returns to be decomposed into high and low frequencies, carefully capturing long-term market trends and short-term fluctuations.
In this article, we explore a data-driven approach to discovering and validating non-standard Fibonacci retracement levels that markets may respect. We present a complete workflow tailored for implementation in MQL5, beginning with data collection and bar or swing detection, and extending through clustering, statistical hypothesis testing, backtesting, and integration into an MetaTrader 5 Fibonacci tool. The goal is to create a reproducible pipeline that transforms anecdotal observations into statistically defensible trading signals.
Unlike what was done in the previous article, here we will test the selection option using an Expert Advisor. Although this is not a final solution yet, it will be enough for now. With the help of this article, you will be able to understand how to implement one of the possible solutions.
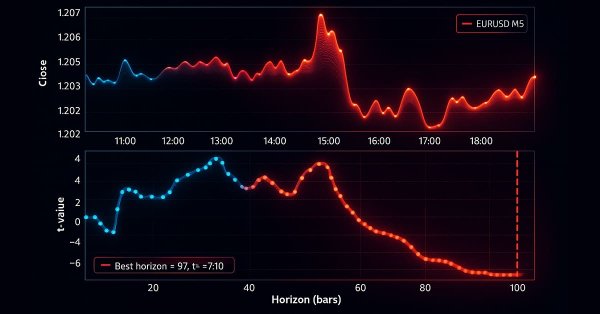
We have built a robust feature engineering pipeline using proper tick-based bars to eliminate data leakage and solved the critical problem of labeling with meta-labeled triple-barrier signals. This installment covers the advanced labeling technique, trend-scanning, for adaptive horizons. After covering the theory, an example shows how trend-scanning labels can be used with meta-labeling to improve on the classic moving average crossover strategy.
We continue our examination of the StockFormer hybrid trading system, which combines predictive coding and reinforcement learning algorithms for financial time series analysis. The system is based on three Transformer branches with a Diversified Multi-Head Attention (DMH-Attn) mechanism that enables the capturing of complex patterns and interdependencies between assets. Previously, we got acquainted with the theoretical aspects of the framework and implemented the DMH-Attn mechanisms. Today, we will talk about the model architecture and training.
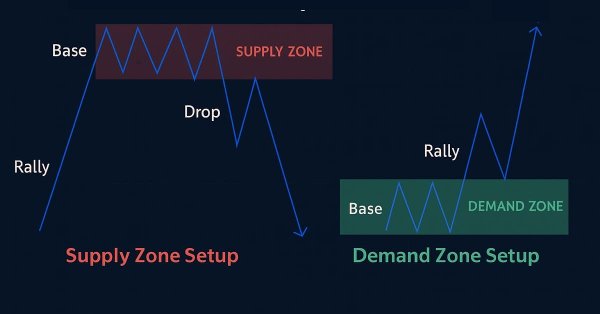
In this article, we create a supply and demand trading system in MQL5 that identifies supply and demand zones through consolidation ranges, validates them with impulsive moves, and trades retests with trend confirmation and customizable risk parameters. The system visualizes zones with dynamic labels and colors, supporting trailing stops for risk management.
In this article, you will learn how to develop an Order Blocks indicator based on order book volume (market depth) and optimize it using buffers to improve accuracy. This concludes the current stage of the project and prepares for the next phase, which will include the implementation of a risk management class and a trading bot that uses signals generated by the indicator.
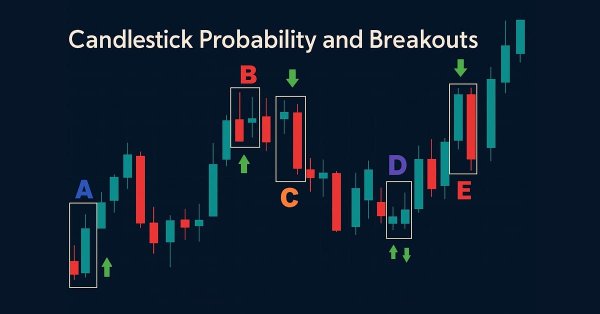
Enhance your market analysis with the MQL5-native Candlestick Probability EA, a lightweight tool that transforms raw price bars into real-time, instrument-specific probability insights. It classifies Pinbars, Engulfing, and Doji patterns at bar close, uses ATR-aware filtering, and optional breakout confirmation. The EA calculates raw and volume-weighted follow-through percentages, helping you understand each pattern's typical outcome on specific symbols and timeframes. On-chart markers, a compact dashboard, and interactive toggles allow easy validation and focus. Export detailed CSV logs for offline testing. Use it to develop probability profiles, optimize strategies, and turn pattern recognition into a measurable edge.
In this article, we upgrade the ChatGPT-integrated program in MQL5 to a scrollable single chat-oriented UI, enhancing conversation history display with timestamps and dynamic scrolling. The system builds on JSON parsing to manage multi-turn messages, supporting customizable scrollbar modes and hover effects for improved user interaction.
We will look at price discretization methods using Python + MQL5. In this article, I will share my practical experience developing a Python library that implements a wide range of approaches to bar formation — from classic Volume and Range bars to more exotic methods like Renko and Kagi. We will consider three-line breakout candles and range bars analyzing their statistics and trying to define how else the prices can be represented discretely.
This article explains how to develop a professional Heikin Ashi-based Expert Advisor (EA) in MQL5. You will learn how to set up input parameters, enumerations, indicators, global variables, and implement the core trading logic. You will also be able to run a backtest on gold to validate your work.
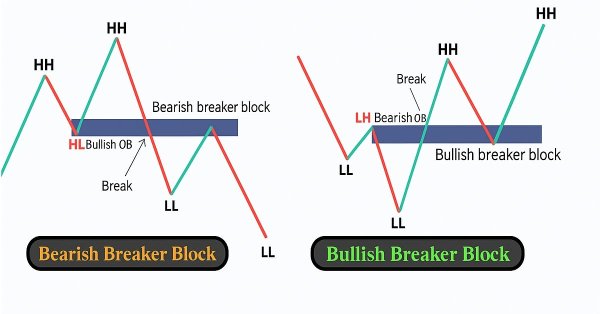
In this article, we create a Breaker Block Trading System in MQL5 that identifies consolidation ranges, detects breakouts, and validates breaker blocks with swing points to trade retests with defined risk parameters. The system visualizes order and breaker blocks with dynamic labels and arrows, supporting automated trading and trailing stops.
Using a ready-made solution in trading without concerning yourself with the internal workings of the system may sound comforting, but this is not always the case for developers. Eventually, an upgrade, misperformance, or unexpected error will arise, and it becomes essential to trace exactly where the issue originates to diagnose and resolve it quickly. Today’s discussion focuses on uncovering what normally happens behind the scenes of a trading Expert Advisor, and on developing a custom dedicated class for displaying and logging backend processes using MQL5. This gives both developers and traders the ability to quickly locate errors, monitor behavior, and access diagnostic information specific to each EA.
In this article, we develop an MQL5 First Run User Setup Wizard for Expert Advisors, featuring a scrollable guide with an interactive dashboard, dynamic text formatting, and visual controls like buttons and a checkbox allowing users to navigate instructions and configure trading parameters efficiently. Users of the program get to have insight of what the program is all about and what to do on the first run, more like an orientation model.
In a world where speed and precision matter, analysis tools need to be as smart as the markets we trade. This article presents an EA built on button logic—an interactive system that instantly transforms raw price data into meaningful statistical levels. With a single click, it calculates and displays mean, deviation, percentiles, and more, turning advanced analytics into clear on-chart signals. It highlights the zones where price is most likely to bounce, retrace, or break, making analysis both faster and more practical.