The article extends MicroStructure_Foundation.mqh with a MicrostructureAnalysis struct and five functions that decompose M1 price variation into a quoted spread proxy, Roll-implied spread, OHLC-based noise ratio, order imbalance, and an adverse selection component. A wrapper populates these fields and links them to the volatility suite from Part 4. Empirical thresholds come from 602 NQ E-mini NY sessions (Jan 2024–Jun 2026), helping you gate volatility signals, size risk, and recognize spread-driven frictions.
For this article we switch to a custom MQL5 Wizard class that examines entry Signals. Our custom class is ‘CSignalDSUDBN’ this time around, and is coded by combining the Disjoint Set Union algorithm with a Deep Belief network. As has been the case throughout these series, our model is testable with MQL5 Wizard-Assembled Expert Advisors that can be tuned with different trailing stops and money management classes.
The article provides a detailed guide to creating the innovative 3DBarCustomSymbol.mq5 indicator, which generates custom symbols in MetaTrader 5 that combine price, time, volume, and volatility into a single three-dimensional representation. The mathematical foundations, system architecture, practical aspects of implementation and application in trading strategies are considered.
The article extends the MQL5 recurrence library to Recurrence Network Analysis (RNA) by treating recurrence matrices as adjacency matrices of undirected graphs. It implements core network metrics—clustering, transitivity, average path length, betweenness, assortativity, and density—and applies them in rolling windows for single-series RNA and Joint RNA (JRNA). A modular metrics engine and two indicators visualize the evolving network structure on MetaTrader 5 charts for practical time-series analysis.
This article builds the Spectrum Fitter: from tau(q) we compute f(alpha) with a discrete Legendre transform, then fit Normal, Binomial, Poisson, and Gamma spectra under box constraints using BLEIC. The best model by SSE is selected, and its parameters (eg, alpha min, alpha max or alpha_0, gamma) become the cascade inputs for multifractal simulation.
The article delivers an object-based MQL5 implementation that detects weekend gaps from time discontinuities and renders them directly on the chart. It manages graphical objects, tracks state transitions (fresh, partial, reaction, filled), and preserves completed gaps as historical zones. The result is a reproducible framework for monitoring how price revisits and fills weekend gap structures.
This article adds eight volatility functions to MicroStructure_Foundation.mqh, including realized volatility, duration-adjusted volatility, fractional volatility, a FIGARCH-inspired proxy, a volatility clustering index, a GJR-GARCH asymmetry measure (using the Dube library), bipower-variation jump detection, and a wrapper function. The MFDFA implementation is revised to return the conventional Legendre-transform Δα with an R² confidence field, replacing the τ-spread proxy used in the original submission. Thresholds are derived from 514 NY sessions of NQ E-mini Nasdaq 100 futures (May 2024–May 2026); no new include file is created.
The article describes and codes MR Swing in MQL5, a mean‑reversion swing approach that combines a 200‑day hysteresis channel with Value Charts, DVO, and SVAPO. We document entry/exit rules for bull and bear regimes and show five‑year backtests on six high‑liquidity Nasdaq stocks. The complete EA code and backtest configurations are provided for reproducibility.
Time gap analysis helps traders identify potential market reversal points. The article discusses what a time gap is, how to interpret it, and how it can be used to detect large volume influxes into the market.
We implement an EquiVolume indicator in MQL5 that converts standard candlesticks into volume-weighted boxes. The workflow includes selecting volume type, detecting the maximum volume within a lookback range, normalizing all values against it, and mapping them into proportional box widths. The result is a chart-based structure that visualizes trading activity intensity alongside price movement in MetaTrader 5.
This article develops an object-oriented framework for MQL5 indicators by evolving a primitive example into reusable modules. It formalizes partial buffer recalculation in OnCalculate, moves logic into header-based classes (CAppliedPrice, CSma), and introduces CSubIndiBase, CIndicatorBase, and a registry to centralize requirements. You get portable components, isolated inputs, and clean buffers with minimal boilerplate, making new indicators faster to assemble and easier to maintain.
Developing permutation-based tools in MQL5 provides a systematic way to analyze candlestick pattern combinations for trading strategies. This article introduces a permutation calculator and generator designed to compute and enumerate all possible ordered candlestick sequences from bullish and bearish sets, with or without repetition. By generating exhaustive pattern combinations, traders can perform data-driven analysis to identify high-probability market patterns and improve decision-making in automated trading systems.
In this article, we shift from Python research to native MQL5 engineering. We build the first module of the MMAR library: a shared constants header, an SVD-based OLS regression class, a Generalized Hurst Exponent estimator, and the partition analysis engine that computes the partition function, extracts tau(q), estimates H via zero-crossing interpolation, and scores multifractality through three diagnostic tests. Tested on 500,000 bars of EURUSD M10, the engine correctly classifies the data as multifractal in under four seconds. Part 4 of an eight-part series. Part 5 fits the tau(q) curve to four candidate distributions via the Legendre transform.
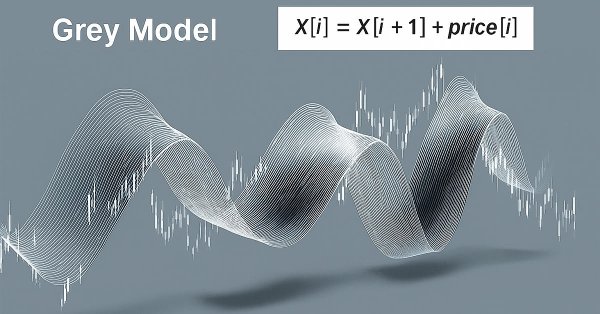
This article explores the grey model, a promising tool that can expand trader's capabilities. We will look at some options for applying this model to technical analysis and building trading strategies.
We extend the RQA library for MetaTrader 5 with JRQA, which detects when two series simultaneously revisit their own past states. The article covers the joint recurrence matrix, twelve JRQA metrics (including TREND and COMPLEXITY), dual-epsilon configuration, and a rolling-window engine with OpenCL acceleration and automatic CPU fallback. A practical indicator plots JRR, JDET, JLAM, JENTR, and JTREND for any symbol pair with timestamp alignment and normalization.
The article delivers a dynamic MetaTrader 5 indicator that detects liquidity sweeps via swing‑point logic, wick‑ratio thresholds, and engulfing confirmation. It recognizes single‑wick and dual‑candle patterns without a fixed window, updates buy‑/sell‑side targets as price evolves, and invalidates broken levels to maintain a reliable liquidity map.
This article builds a Market Structure Sentinel indicator in MQL5 that detects and visualizes Smart Money Concepts (SMC) events, including Break of Structure (BOS) and Change of Character (CHOCH), in real time. It explains swing detection, structural validation, and trend classification, and adds a compact dashboard to track bullish, bearish, or ranging states for faster on‑chart interpretation.
Build a megaphone pattern indicator in MQL5 that detects expanding structures on the chart. The article walks through swing identification and refinement, trend line validation, breakout confirmation, and SL/TP projection, with chart objects for lines, labels, and signals. As a result, you get a rule-based implementation that automates pattern detection and produces actionable levels directly in MetaTrader 5.
Part 2 focuses on practical long-memory detection for intraday data. Three complementary Hurst estimators are implemented and combined into a confidence‑weighted composite, with confidence tied to valid regression scales. The final H and confidence populate the shared analysis struct, enabling indicators to act only when H departs from the neutral 0.40–0.60 band and to select trend‑following above 0.60 or mean‑reversion below 0.40.
The article examines the quality of a seasonal trading approach on a daily timeframe, both for individual symbols and for spreads. Particular attention is paid to identifying recurring monthly cycles and the possibilities of their application in trading within the current year.
This article shows how to convert subjective flag recognition into reproducible MQL5 logic for live charts. It combines ATR-normalized pole strength, retracement limits, consolidation structure checks, breakout confirmation, and overlap control. Readers gain a workable approach that renders adaptive channels and zones, updates active setups efficiently, and provides optional alerts for newly confirmed patterns.
This article examines a comprehensive approach to developing trading algorithms: from project setup and logic debugging to protecting the finished product. We will explore MetaEditor's built-in tools, including step-by-step debugging using real ticks, performance profiling, and direct integration with C++ DLLs to speed up calculations. The article also explains how to protect intellectual property using MQL5 Cloud Protector. The application of the described techniques will transform Expert Advisor development from a chaotic search for solutions into a systematic process, significantly reducing the time required to develop a strategy.
The article adds a self-adaptive layer to the Malaysian Engulfing indicator by optimizing the retest bar range with a constrained brute-force search scored by MFE and MAE. It details the data model, helper routines, and an MQL5 implementation that gathers historical setups, computes excursions, and selects the best parameter. Readers learn how to remove manual tuning and run the indicator with context-appropriate settings across symbols and timeframes.
The article presents two systematic pitfalls in MQL5 multi‑timeframe work: indicator handle leaks that exhausted resources and repainting from reading the forming bar (index 0). It introduces MTFEngine.mqh, a unified include that creates and tracks handles in one place and defaults all reads to closed bars (index 1). A D1–H4–H1 example shows how this approach keeps signals technically correct and consistent with charts.
Implement the Malaysian Engulfing concept in MQL5 with two coordinated indicators. One applies strict, body‑based engulfing rules for precise pattern detection; the other uses a state-driven model to monitor what follows—pullbacks and timed retests—directly on the chart. The result is a repeatable, rule-based workflow that replaces visual guesswork with programmable logic.
This article tests three common filters on a standard MACD crossover for US_TECH100 H1 using five years of broker-native data. Filters are layered incrementally: regime, higher timeframe (HTF) alignment, and US session timing, to isolate each one's marginal impact. Results show session timing contributes far more than indicator refinements, while regime and HTF add little on their own. Includes a reproducible MQL5 regime classifier.
Create an object-oriented fair value gap (FVG) scanner in MQL5 and display liquidity gaps directly on a MetaTrader 5 chart, this article formalizes the imbalance geometry based on three candlesticks, synchronizes OHLC arrays with CopyRates, manages rectangles without leaks, and monitors mitigation in real time. It also shows how to integrate this class into an Expert Advisor with a strict new bar filter for stable and efficient execution.
We present a chart-embedded RSI panel that removes the need for a separate window by attaching momentum directly to live price. The article explains the design and MQL5 code: real-time RSI retrieval, slope-based signal classification, and adaptive positioning. Traders get RSI value, state, and signal strength where decisions are made, improving clarity across timeframes.
This article builds a complete Recurrence Quantification Analysis (RQA) toolkit for MetaTrader 5 in pure MQL5. We cover phase-space reconstruction, time-delay embedding, distance and recurrence matrix construction, RQA metric extraction, automatic epsilon selection, and rolling-window computation through a modular library design. The article concludes by applying the library in a practical indicator that plots RR, DET, LAM, ENTR, and TREND directly on the chart, providing a solid foundation for nonlinear time-series analysis in MQL5.
Build a Liquidity Spectrum Volume Profile in MQL5 that allocates volume to equal price bins over a chosen lookback using candle close prices. The guide covers data retrieval with copy functions, binning and normalization, and drawing rectangles and POC lines with chart objects and time offsets to reveal high-activity liquidity zones on the chart.
An MQL5 control system that blocks orders outside scheduled trading hours and during scheduled news releases, converting time rules into executable restrictions. It combines a permissions management mechanism, a transaction-level expert advisor, and a visual dashboard for real-time status and upcoming restrictions. Configuration is accomplished using editable files, with caching and a CSV audit log for traceability.
Forecasting the movements of currency pairs is an important factor in trading success. This article explores various price movement models, analyzes their advantages and disadvantages, and explores their practical application in trading strategies. We will consider approaches that allow us to identify hidden patterns and improve the accuracy of forecasts.
Create a traditional Renko indicator in MQL5 that converts candlestick closing prices into fixed-size blocks displayed on the main chart. We calculate the movement from the closing price of the last block, create new blocks of a user-defined size, confirm reversals using the two-block rule, manage block closing prices in a dynamic array, and display rectangles for visualizing the trend in real time.
Head and Shoulders patterns are difficult to identify consistently in live market data due to noise and structural ambiguity. This article presents a structured, triangle-based MQL5 indicator that isolates pattern components, constructs the neckline, and validates formations using ATR, symmetry, and slope constraints. The system detects and draws standard and inverse patterns, assigns a quality score, and confirms breakouts with optional alerts, enabling consistent and rule-based chart analysis.
This article builds the user interface layer of an Account Audit System in MQL5 using CChartObject classes. We construct an on-chart dashboard that displays key metrics such as start/end balance, net profit, total trades, wins/losses, win rate, withdrawals, and a star-based performance rating. A menu button lets you show or hide the panel and restores one-click trading, delivering a clean, usable foundation for the broader audit pipeline.
We revamp our earlier articles on testing trade setups with the MQL5 Wizard by putting a bit more emphasis on input data quality, cleaning, and handling. In the earlier articles we had looked at a lot of custom signal classes, usable by the wizard, so we now shift our focus to a custom trailing class, given that exiting is also a very important part in any trading system. Our broad theme for this particular piece data-efficiency and the O(1) range-query; the core ‘tech’ is MQL5, SQLite, Python-Polars; the Algorithm is the Sparse-Table while we will seek validation from the ATR Indicator.
GoertzelBrain combines Goertzel spectral analysis with an online‑trained neural network ensemble to convert cycle features into a directional confirmation signal. The indicator builds a compact feature vector from the dominant period, amplitude, confidence and their dynamics, plus local volatility, and outputs +1, −1 or 0. The article provides the full MQL5 implementation, explains the architecture and feature engineering, and shows how to use it as a directional filter.
Integer differentiation forces a binary choice between stationarity and memory: returns (d=1) are stationary but discard all price-level information; raw prices (d=0) preserve memory but violate ML stationarity assumptions. We implement the fixed-width fractional differentiation (FFD) method from AFML Chapter 5, covering get_weights_ffd (iterative recurrence with threshold cutoff), frac_diff_ffd (bounded dot product per bar), and fracdiff_optimal (binary search for minimum stationary d*).
The article demonstrates how to build a Volume Bubble Indicator in MQL5 that visualizes market activity using statistical normalization. It covers how to work with tick and real volume, compute the mean and standard deviation over a rolling window, and normalize volume values to identify relative strength. You will implement chart objects to display bubbles with dynamic size and color, providing a clear representation of volume intensity directly on the chart.
This article extends the MQL5 footprint chart with market-structure and order-flow layers: volume-profile bars, point of control, value-area highlighting, stacked imbalance detection, absorption zones, and single-print/unfinished markers. We expand bar data structures, add functions for POC/value area, imbalance, and absorption, and build a fixed-order rendering pipeline. You will get ready-to-use inputs, metadata, and drawing utilities to integrate and customize these layers in your indicator.