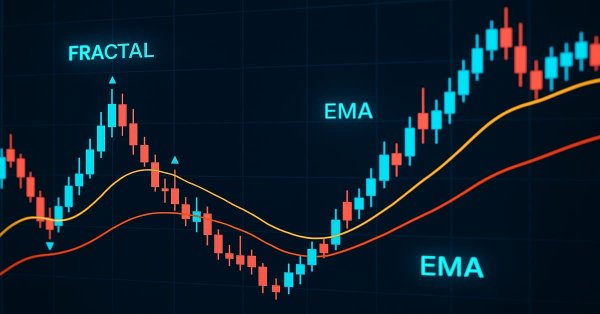
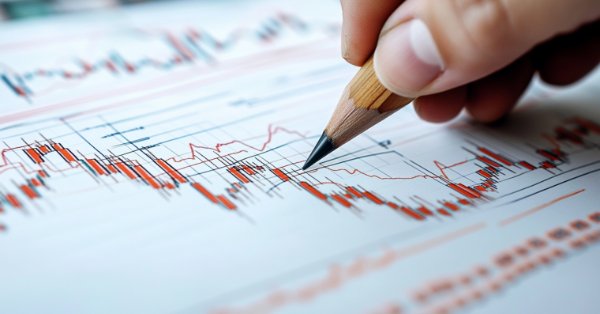
Price action is a fundamental approach for identifying profitable trading setups. However, manually monitoring price movements and patterns can be challenging and time-consuming. To address this, we are developing tools that analyze price action automatically, providing timely signals whenever potential opportunities are detected. This article introduces a robust tool that leverages fractal breakouts alongside EMA 14 and EMA 200 to generate reliable trading signals, helping traders make informed decisions with greater confidence.
In this article, we will get acquainted with the ALGLIB library optimization methods for MQL5. The article includes simple and clear examples of using ALGLIB to solve optimization problems, which will make mastering the methods as accessible as possible. We will take a detailed look at the connection of such algorithms as BLEIC, L-BFGS and NS, and use them to solve a simple test problem.
In this series of articles, we have considered multiple different ways of identifying the best period to use our technical indicators with. Today, we shall demonstrate to the reader how they can instead perform the opposite logic, that is to say, instead of picking the single best period to use, we will demonstrate to the reader how to employ all available periods effectively. This approach reduces the amount of data discarded, and offers alternative use cases for machine learning algorithms beyond ordinary price prediction.
In this article, we will look at how to use the CustomBookAdd function correctly and effectively. Despite its apparent simplicity, it has many nuances. For example, it allows you to tell the mouse indicator whether a custom symbol is on auction, being traded, or the market is closed. The content presented here is intended solely for educational purposes. Under no circumstances should the application be viewed for any purpose other than to learn and master the concepts presented.
MetaTrader 5 python package provides an easy way to build trading applications for the MetaTrader 5 platform in the Python language, while being a powerful and useful tool, this module isn't as easy as MQL5 programming language when it comes to making an algorithmic trading solution. In this article, we are going to build trade classes similar to the one offered in MQL5 to create a similar syntax and make it easier to make trading robots in Python as in MQL5.
Geometric patterns offer traders a concise way to interpret price action. Many analysts draw trend lines, rectangles, and other shapes by hand, and then base trading decisions on the formations they see. In this article, we explore an automated alternative: harnessing MQL5 to detect and analyze the most popular geometric patterns. We’ll break down the methodology, discuss implementation details, and highlight how automated pattern recognition can sharpen a trader's market insights.
Candlestick patterns offer valuable insights into potential market moves. Some single candles signal continuation of the current trend, while others foreshadow reversals, depending on their position within the price action. This article introduces an EA that automatically identifies four key candlestick formations. Explore the following sections to learn how this tool can enhance your price-action analysis.
Today we will look at why we need the iSpread feature. At the same time, we will understand how the system informs us about the remaining time of the bar when there is not a single tick available for it. The content presented here is intended solely for educational purposes. Under no circumstances should the application be viewed for any purpose other than to learn and master the concepts presented.
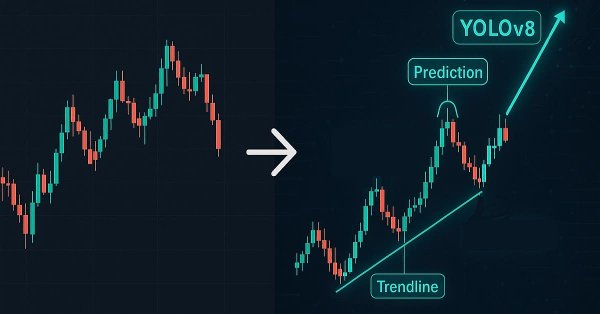
Detecting patterns in financial markets is challenging because it involves seeing what's on the chart, something that's difficult to undertake in MQL5 due to image limitations. In this article, we are going to discuss a decent model made in Python that helps us detect patterns present on the chart with minimal effort.
Do you know what really drives a currency pair’s direction? It’s the strength of each individual currency. In this article, we’ll measure a currency’s strength by looping through every pair it appears in. That insight lets us predict how those pairs may move based on their relative strengths. Read on to learn more.
Fibonacci retracements are a popular tool in technical analysis, helping traders identify potential reversal zones. In this article, we’ll explore how these retracement levels can be transformed into target variables for machine learning models to help them understand the market better using this powerful tool.
Today we will continue working on getting the mouse pointer to tell us how much time is left on a bar during periods of low liquidity. Although at first glance it seems simple, in reality this task is much more difficult. This involves some obstacles that we will have to overcome. Therefore, it is important that you have a good understanding of the material in this first part of this subseries in order to understand the following parts.
The article considers a metaheuristic Artificial Ecosystem-based Optimization (AEO) algorithm, which simulates interactions between ecosystem components by creating an initial population of solutions and applying adaptive update strategies, and describes in detail the stages of AEO operation, including the consumption and decomposition phases, as well as different agent behavior strategies. The article introduces the features and advantages of this algorithm.
News drives the financial markets, especially major releases like Non-Farm Payrolls (NFPs). We've all witnessed how a single headline can trigger sharp price movements. In this article, we dive into the powerful intersection of news data and Artificial Intelligence.
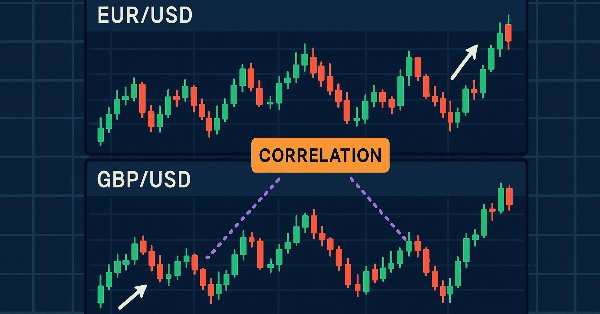
This tool is a Correlation Dashboard that calculates and displays real-time correlation coefficients across multiple currency pairs. By visualizing how pairs move in relation to one another, it adds valuable context to your price-action analysis and helps you anticipate inter-market dynamics. Read on to explore its features and applications.
In this article, we'll look at what can be achieved with a little code refinement. This refinement is aimed at simplifying our code, making more use of MQL5 library calls and, above all, making it much more stable, secure and easy to use in other projects that we may develop in the future.
In the article, an attempt is made to build a trading EA for predicting exchange rate quotes. The algorithm is based on classical classification models - logistic and probit regression. The likelihood ratio criterion is used as a filter for trading signals.
Today, we are focusing on the enhancement of the Communications Panel messaging interface to align with the standards of modern, high-performing communication applications. This improvement will be achieved by updating the CommunicationsDialog class. Join us in this article and discussion as we explore key insights and outline the next steps in advancing interface programming using MQL5.
Are there any repeating patterns and regularities in the Forex market? I decided to create my own pattern analysis system using Python and MetaTrader 5. A kind of symbiosis of math and programming for conquering Forex.
In this article, we will create an arbitration system that remains legal in the eyes of brokers, creates thousands of synthetic prices on the Forex market, analyzes them, and successfully trades for profit.
The AI breakthroughs dominating headlines, from ChatGPT to self-driving cars, aren’t built from isolated models but through cumulative knowledge transferred from various models or common fields. Now, this same "learn once, apply everywhere" approach can be applied to help us transform our AI models in algorithmic trading. In this article, we are going to learn how we can leverage the information gained across various instruments to help in improving predictions on others using transfer learning.
In this article, we will implement the first solution that will allow us to determine when a new bar may appear on the chart. This solution is applicable in a wide variety of situations. Understanding its development will help you grasp several important aspects. The content presented here is intended solely for educational purposes. Under no circumstances should the application be viewed for any purpose other than to learn and master the concepts presented.
Candlestick patterns help traders understand market psychology and identify trends in financial markets, they enable more informed trading decisions that can lead to better outcomes. In this article, we will explore how to use candlestick patterns with AI models to achieve optimal trading performance.
The Market Structure Flip Detector Expert Advisor (EA) acts as your vigilant partner, constantly observing shifts in market sentiment. By utilizing Average True Range (ATR)-based thresholds, it effectively detects structure flips and labels each Higher Low and Lower High with clear indicators. Thanks to MQL5’s swift execution and flexible API, this tool offers real-time analysis that adjusts the display for optimal readability and provides a live dashboard to monitor flip counts and timings. Furthermore, customizable sound and push notifications guarantee that you stay informed of critical signals, allowing you to see how straightforward inputs and helper routines can transform price movements into actionable strategies.
In this article, we will continue diving into the implementation of the ACMO (Atmospheric Cloud Model Optimization) algorithm. In particular, we will discuss two key aspects: the movement of clouds into low-pressure regions and the rain simulation, including the initialization of droplets and their distribution among clouds. We will also look at other methods that play an important role in managing the state of clouds and ensuring their interaction with the environment.
Financial markets are not perfectly balanced. Some markets are bullish, some are bearish, and some exhibit some ranging behaviors indicating uncertainty in either direction, this unbalanced information when used to train machine learning models can be misleading as the markets change frequently. In this article, we are going to discuss several ways to tackle this issue.
Today, we are harnessing the capabilities of MQL5 to utilize external resources—such as images in the BMP format—to create a uniquely styled home interface for the Trading Administrator Panel. The strategy demonstrated here is particularly useful when packaging multiple resources, including images, sounds, and more, for streamlined distribution. Join us in this discussion as we explore how these features are implemented to deliver a modern and visually appealing interface for our New_Admin_Panel EA.
In this article, we will look at how to implement and solve the mouse pointer issue when using it in conjunction with a replay/simulation application. The content presented here is intended solely for educational purposes. Under no circumstances should the application be viewed for any purpose other than to learn and master the concepts presented.
Correlation Pathfinder offers a fresh approach to understanding currency pair dynamics as part of the Price Action Analysis Toolkit Development Series. This tool automates data collection and analysis, providing insight into how pairs like EUR/USD and GBP/USD interact. Enhance your trading strategy with practical, real-time information that helps you manage risk and spot opportunities more effectively.
Opening Range Breakout (ORB) strategies are built on the idea that the initial trading range established shortly after the market opens reflects significant price levels where buyers and sellers agree on value. By identifying breakouts above or below a certain range, traders can capitalize on the momentum that often follows as the market direction becomes clearer. In this article, we will explore three ORB strategies adapted from the Concretum Group.
In this article, we will look at how to fix two errors in the code. However, I will try to explain them in a way that will help you, beginner programmers, understand that things don't always go as you expect. Anyway, this is an opportunity to learn. The content presented here is intended solely for educational purposes. In no way should this application be considered as a final document with any purpose other than to explore the concepts presented.
In this article, we will finally solve the problems with the simulation of ticks on a one-minute bar so that they can coexist with real ticks. This will help us avoid problems in the future. The material presented here is for educational purposes only. Under no circumstances should the application be viewed for any purpose other than to learn and master the concepts presented.
This article describes the fundamentals of portfolio-level statistical arbitrage. Its goal is to facilitate the understanding of the principles of statistical arbitrage to readers without deep math knowledge and propose a starting point conceptual framework. The article includes a working Expert Advisor, some notes about its one-year backtest, and the respective backtest configuration settings (.ini file) for the reproduction of the experiment.
The article is devoted to the metaheuristic Atmosphere Clouds Model Optimization (ACMO) algorithm, which simulates the behavior of clouds to solve optimization problems. The algorithm uses the principles of cloud generation, movement and propagation, adapting to the "weather conditions" in the solution space. The article reveals how the algorithm's meteorological simulation finds optimal solutions in a complex possibility space and describes in detail the stages of ACMO operation, including "sky" preparation, cloud birth, cloud movement, and rain concentration.
This article explores the potential of the Value at Risk (VaR) model for multi-currency portfolio optimization. Using the power of Python and the functionality of MetaTrader 5, we demonstrate how to implement VaR analysis for efficient capital allocation and position management. From theoretical foundations to practical implementation, the article covers all aspects of applying one of the most robust risk calculation systems – VaR – in algorithmic trading.
Larry Connors is a renowned trader and author, best known for his work in quantitative trading and strategies like the 2-period RSI (RSI2), which helps identify short-term overbought and oversold market conditions. In this article, we’ll first explain the motivation behind our research, then recreate three of Connors’ most famous strategies in MQL5 and apply them to intraday trading of the S&P 500 index CFD.
In this article, we will begin to address the issue of tick excess that can impact application performance when using real data. This excess often interferes with the correct timing required to construct a one-minute bar in the appropriate window.
NumPy library is powering almost all the machine learning algorithms to the core in Python programming language, In this article we are going to implement a similar module which has a collection of all the complex code to aid us in building sophisticated models and algorithms of any kind.
In this article, we will look at changes that will allow the replay/simulation system to operate more efficiently and securely. I will also not leave without attention those who want to get the most out of using classes. In addition, we will consider a specific problem in MQL5 that reduces code performance when working with classes, and explain how to solve it.