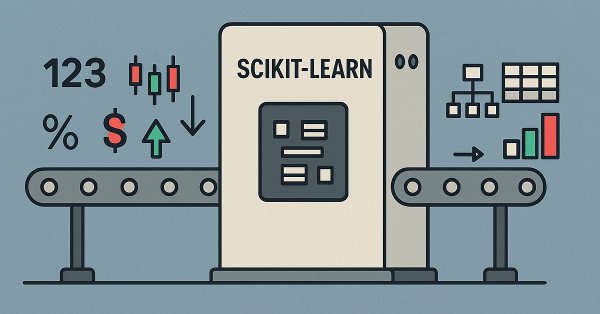
In this piece, we look at a key data preparation step for machine learning that is gaining rapid significance. Data Preprocessing Pipelines. These in essence are a streamlined sequence of data transformation steps that prepare raw data before it is fed to a model. As uninteresting as this may initially seem to the uninducted, this ‘data standardization’ not only saves on training time and execution costs, but it goes a long way in ensuring better generalization. In this article we are focusing on some SCIKIT-LEARN preprocessing functions, and while we are not exploiting the MQL5 Wizard, we will return to it in coming articles.
This article explores the unique identity of each currency pair through the lens of its historical price action. Inspired by the concept of genetic DNA, which encodes the distinct blueprint of every living being, we apply a similar framework to the markets, treating price action as the “DNA” of each pair. By breaking down structural behaviors such as volatility, swings, retracements, spikes, and session characteristics, the tool reveals the underlying profile that distinguishes one pair from another. This approach provides more profound insight into market behavior and equips traders with a structured way to align strategies with the natural tendencies of each instrument.
The article describes an innovative approach to forecasting price movements in financial markets using quantum computing. The main focus is on the application of the Quantum Phase Estimation (QPE) algorithm to find prototypes of price patterns allowing traders to significantly speed up the market data analysis.
In the previous article, we introduced the multi-agent adaptive framework MASAAT, which uses an ensemble of agents to perform cross-analysis of multimodal time series at different data scales. Today we will continue implementing the approaches of this framework in MQL5 and bring this work to a logical conclusion.
This is an article that I have written aimed to expound and explain Fair Value Gaps, their formation logic for occurring, and automated trading with breakers and market structure shifts.
Dynamic mode decomposition (DMD) is a technique usually applied to high-dimensional datasets. In this article, we demonstrate the application of DMD on univariate time series, showing its ability to characterize a series as well as make forecasts. In doing so, we will investigate MQL5's built-in implementation of dynamic mode decomposition, paying particular attention to the new matrix method, DynamicModeDecomposition().
This article describes a simple but comprehensive statistical arbitrage pipeline for trading a basket of cointegrated stocks. It includes a fully functional Python script for data download and storage; correlation, cointegration, and stationarity tests, along with a sample Metatrader 5 Service implementation for database updating, and the respective Expert Advisor. Some design choices are documented here for reference and for helping in the experiment replication.
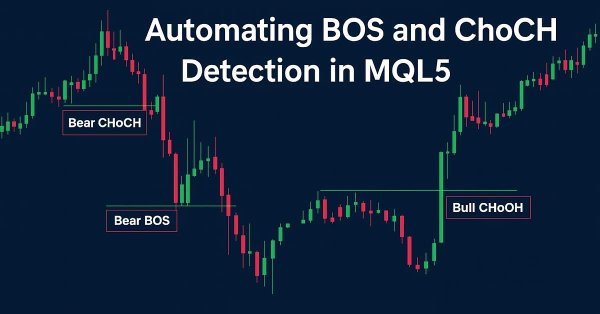
This article presents Fractal Reaction System, a compact MQL5 system that converts fractal pivots into actionable market-structure signals. Using closed-bar logic to avoid repainting, the EA detects Change-of-Character (ChoCH) warnings and confirms Breaks-of-Structure (BOS), draws persistent chart objects, and logs/alerts every confirmed event (desktop, mobile and sound). Read on for the algorithm design, implementation notes, testing results and the full EA code so you can compile, test and deploy the detector yourself.
Today we will begin the second stage, where we will look at the market replay/simulation system. First, we will show a possible solution for cross orders. I will show you the solution, but it is not final yet. It will be a possible solution to a problem that we will need to solve in the near future.
The article presents the Big Bang - Big Crunch method, which has two key phases: cyclic generation of random points and their compression to the optimal solution. This approach combines exploration and refinement, allowing us to gradually find better solutions and open up new optimization opportunities.
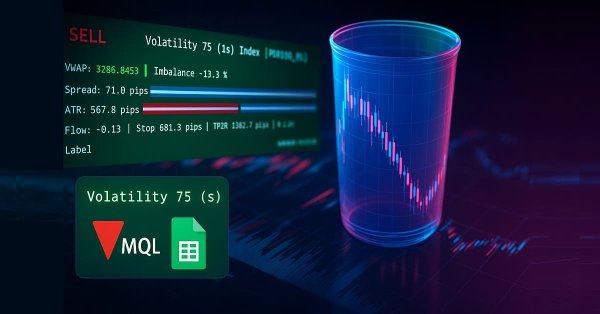
In Part 38, we build a production-grade MT5 monitoring panel that converts raw ticks into actionable signals. The EA buffers tick data to compute tick-level VWAP, a short-window imbalance (flow) metric, and ATR-based position sizing. It then visualizes spread, ATR, and flow with low-flicker bars. The system calculates a suggested lot size and a 1R stop, and issues configurable alerts for tight spreads, strong flow, and edge conditions. Auto-trading is intentionally disabled; the focus remains on robust signal generation and a clean user experience.
The Black Hole Algorithm (BHA) uses the principles of black hole gravity to optimize solutions. In this article, we will look at how BHA attracts the best solutions while avoiding local extremes, and why this algorithm has become a powerful tool for solving complex problems. Learn how simple ideas can lead to impressive results in the world of optimization.
In this article, we will look at how to implement part of the receiver code. Here we will implement an Expert Advisor to test and learn how the protocol interaction works. The content presented here is intended solely for educational purposes. Under no circumstances should the application be viewed for any purpose other than to learn and master the concepts presented.
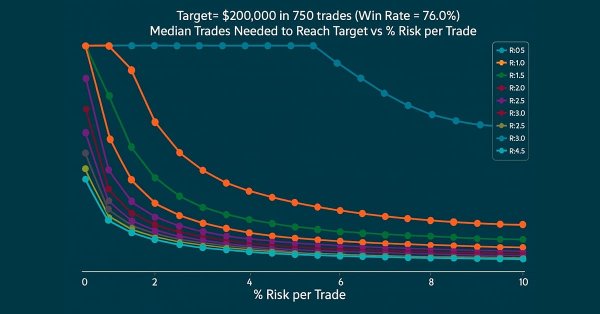
Every trader's ultimate goal is profitability, which is why many set specific profit targets to achieve within a defined trading period. In this article, we will use Monte Carlo simulations to determine the optimal risk percentage per trade needed to meet trading objectives. The results will help traders assess whether their profit targets are realistic or overly ambitious. Finally, we will discuss which parameters can be adjusted to establish a practical risk percentage per trade that aligns with trading goals.
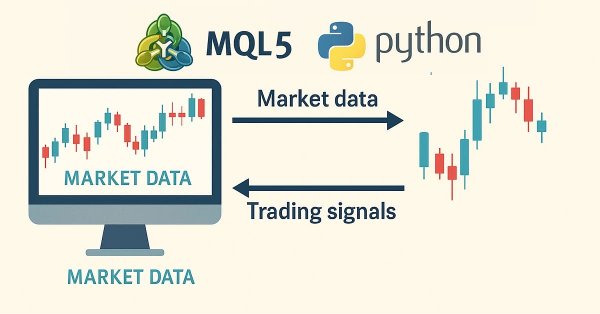
We are going to develop a modular trading system that combines Python for data analysis with MQL5 for trade execution. Four independent modules monitor different market aspects in parallel: volumes, arbitrage, economics and risks, and use RandomForest with 400 trees for analysis. Particular emphasis is placed on risk management, since even the most advanced trading algorithms are useless without proper risk management.
This article demonstrates a secure way to export MetaTrader data to Google Sheets. Google Sheet is the most valuable solution as it is cloud based and the data saved in there can be accessed anytime and from anywhere. So traders can access trading and related data exported to google sheet and do further analysis for future trading anytime and wherever they are at the moment.
In this article, we delve into enhancing the details of trading reports and delivering the final document via email in PDF format. This marks a progression from our previous work, as we continue exploring how to harness the power of MQL5 and Python to generate and schedule trading reports in the most convenient and professional formats. Join us in this discussion to learn more about optimizing trading report generation within the MQL5 ecosystem.
In this article, we will cover some of the measures and precautions to consider when creating a communication protocol. These are pretty simple and straightforward things, so we won't go into too much detail in this article. But to understand what will happen, you need to understand the content of the article.
In this article, we develop a Bat Pattern system in MQL5 that identifies bullish and bearish Bat harmonic patterns using pivot points and Fibonacci ratios, triggering trades with precise entry, stop loss, and take-profit levels, enhanced with visual feedback through chart objects
Continuing tries to decipher price movements... What about linguistic analysis of the "market dictionary" that we get by converting the binary price code to BIP39? In this article, we will delve into an innovative approach to exchange data analysis and consider how modern natural language processing techniques can be applied to the market language.
The article provides a detailed discussion of the key components and innovations of the ATA optimization algorithm, which is an evolutionary method with a unique dual behavior system that adapts depending on the situation. ATA combines individual and social learning while using crossover for explorations and migration to find solutions when stuck in local optima.
This article presents an innovative approach to technical analysis based on converting price movements into binary code. The author demonstrates how various aspects of market behavior — from simple price movements to complex patterns — can be encoded in a sequence of zeros and ones.
This article presents a sample MQL5 Service implementation for updating a newly created database used as source for data analysis and for trading a basket of cointegrated stocks. The rationale behind the database design is explained in detail and the data dictionary is documented for reference. MQL5 and Python scripts are provided for the database creation, schema initialization, and market data insertion.
In this second installment of the MetaTrader 5 Machine Learning Blueprint series, you’ll discover why simple labels can lead your models astray—and how to apply advanced techniques like the Triple-Barrier and Trend-Scanning methods to define robust, risk-aware targets. Packed with practical Python examples that optimize these computationally intensive techniques, this hands-on guide shows you how to transform noisy market data into reliable labels that mirror real-world trading conditions.
Market sentiment is one of the most overlooked yet powerful forces influencing price movement. While most traders rely on lagging indicators or guesswork, the Sentiment Tilt Meter (STM) EA transforms raw market data into clear, visual guidance, showing whether the market is leaning bullish, bearish, or staying neutral in real-time. This makes it easier to confirm trades, avoid false entries, and time market participation more effectively.
In this article, we develop a Crab Harmonic Pattern system in MQL5 that identifies bullish and bearish Crab harmonic patterns using pivot points and Fibonacci ratios, triggering trades with precise entry, stop loss, and take-profit levels. We incorporate visual feedback through chart objects like triangles and trendlines to display the XABCD pattern structure and trade levels.
This article explores the powerful role of matrix factorization in algorithmic trading, specifically within MQL5 applications. From regression models to multi-target classifiers, we walk through practical examples that demonstrate how easily these techniques can be integrated using built-in MQL5 functions. Whether you're predicting price direction or modeling indicator behavior, this guide lays a strong foundation for building intelligent trading systems using matrix methods.
In this article, we'll look at how the code of DispatchMessage, missing from the previous article, works. We will laso introduce the topic of the next article. For this reason, it is important to understand how this code works before moving on to the next topic. The content presented here is intended solely for educational purposes. Under no circumstances should the application be viewed for any purpose other than to learn and master the concepts presented.
This part focuses on building a flexible, adaptive trading model trained on historical XAUUSD data, preparing it for ONNX export and potential integration into live trading systems.
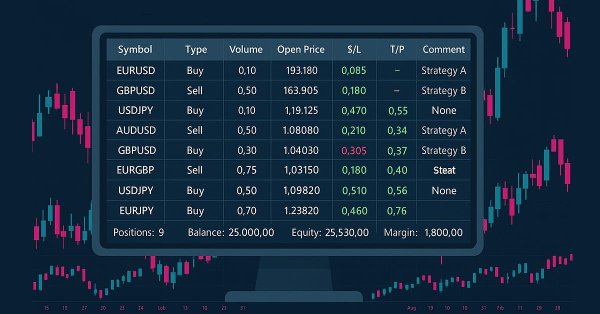
In this article, we develop an enhanced informational dashboard that upgrades the previous part by adding draggable and minimizable features for improved user interaction, while maintaining real-time monitoring of multi-symbol positions and account metrics.
Even with a positive-expectancy system, position sizing determines whether you thrive or collapse. It’s the pivot of risk management—translating statistical edges into real-world results while safeguarding your capital.
This article presents a sample Expert Advisor implementation for trading a basket of four Nasdaq stocks. The stocks were initially filtered based on Pearson correlation tests. The filtered group was then tested for cointegration with Johansen tests. Finally, the cointegrated spread was tested for stationarity with the ADF and KPSS tests. Here we will see some notes about this process and the results of the backtests after a small optimization.
In this discussion, we will set the foundation for using powerful linear, algebra tools that are implemented in the MQL5 matrix and vector API. For us to make proficient use of this API, we need to have a firm understanding of the principles in linear algebra that govern intelligent use of these methods. This article aims to get the reader an intuitive level of understanding of some of the most important rules of linear algebra that we, as algorithmic traders in MQL5 need,to get started, taking advantage of this powerful library.
The article presents the second half of a structured approach to trading with the Gator Oscillator and Accumulation/Distribution. By introducing five new patterns, the author shows how to filter false moves, detect early reversals, and align signals across timeframes. With clear coding examples and performance tests, the material bridges theory and practice for MQL5 developers.
Historical data is far from “trash”—it’s the foundation of any robust market analysis. In this article, we’ll take you step‑by‑step from collecting that history to using it to train a predictive model, and finally deploying that model for live price forecasts. Read on to learn how!
The article presents a simple and accessible way to use a neural network in a trading EA that does not require deep knowledge of machine learning. The method eliminates the target function normalization, as well as overcomes "weight explosion" and "network stall" issues offering intuitive training and visual control of the results.
In this article, we develop an informational dashboard in MQL5 for monitoring multi-symbol positions and account metrics like balance, equity, and free margin. We implement a sortable grid with real-time updates, CSV export, and a glowing header effect to enhance usability and visual appeal.
How does portfolio trading work on Forex? How can Markowitz portfolio theory for portfolio proportion optimization and VaR model for portfolio risk optimization be synthesized? We create a code based on portfolio theory, where, on the one hand, we will get low risk, and on the other, acceptable long-term profitability.
Discovering a new world of automated trading on 3D bars. What does a trading robot look like on multidimensional price bars? Are "yellow" clusters of 3D bars able to predict trend reversals? What does multidimensional trading look like?
Factorization is a mathematical process used to gain insights into the attributes of data. When we apply factorization to large sets of market data — organized in rows and columns — we can uncover patterns and characteristics of the market. Factorization is a powerful tool, and this article will show how you can use it within the MetaTrader 5 terminal, through the MQL5 API, to gain more profound insights into your market data.