The Camel Algorithm, developed in 2016, simulates the behavior of camels in the desert to solve optimization problems, taking into account temperature, supply, and endurance. This article also presents a modified version of the algorithm (CAm) with key improvements: the use of a Gaussian distribution in generating solutions and the optimization of the oasis effect parameters.
The article discusses the non-parametric HSIC (Hilbert-Schmidt Independence Criterion) statistical test designed to identify linear and non-linear dependencies in data. Implementations of two algorithms for calculating HSIC in the MQL5 language are proposed: the exact permutation test and the gamma approximation. The method efficiency is demonstrated on synthetic data modeling a non-linear relationship between features and the target variable.
In this article, we explore the butterfly curve, a parametric mathematical equation, and render it visually on a MQL5 canvas. We build an interactive display with a draggable, resizable canvas window, supersampled curve rendering, gradient backgrounds, and a color-segmented legend. By the end, we have a fully functional visual tool that plots the butterfly curve directly on the MetaTrader 5 chart.
Hidden Markov Models (HMMs) are a powerful class of probabilistic models designed to analyze sequential data, where observed events depend on some sequence of unobserved (hidden) states that form a Markov process. The main assumptions of HMM include the Markov property for hidden states, meaning that the probability of transition to the next state depends only on the current state, and the independence of observations given knowledge of the current hidden state.
The article presents a new metaheuristic method based on a fractal approach to partitioning the search space for solving optimization problems. The algorithm sequentially identifies and separates promising areas, creating a self-similar fractal structure that concentrates computing resources on the most promising areas. A unique mutation mechanism aimed at better solutions ensures an optimal balance between exploration and exploitation of the search space, significantly increasing the efficiency of the algorithm.
The article contains a detailed description of the cross-rate calculation algorithm, a visualization of the imbalance matrix, and recommendations for optimally setting the MinDiscrepancy and MaxRisk parameters for efficient trading. The system automatically calculates the "fair value" of each currency pair using cross rates, generating buy signals in case of negative deviations and sell signals in case of positive ones.
We continue studying the chaotic optimization algorithm. The second part of the article deals with the practical aspects of the algorithm implementation, its testing and conclusions.
This is an improved chaotic optimization algorithm (COA) that combines the effects of chaos with adaptive search mechanisms. The algorithm uses a set of chaotic maps and inertial components to explore the search space. The article reveals the theoretical foundations of chaotic methods of financial optimization.
This article extends the MQL5 footprint chart with market-structure and order-flow layers: volume-profile bars, point of control, value-area highlighting, stacked imbalance detection, absorption zones, and single-print/unfinished markers. We expand bar data structures, add functions for POC/value area, imbalance, and absorption, and build a fixed-order rendering pipeline. You will get ready-to-use inputs, metadata, and drawing utilities to integrate and customize these layers in your indicator.
How to use Renko bars with AI? Let's look at Renko trading on Forex with forecast accuracy of up to 59.27%. We will explore the benefits of Renko bars for filtering market noise, learn why volume is more important than price patterns, and how to set the optimal Renko block size for EURUSD. This is a step-by-step guide on integrating CatBoost, Python, and MetaTrader 5 to create your own Renko Forex forecasting system. It is ideal for traders looking to go beyond traditional technical analysis.
The article examines the theoretical and practical aspects of the singular spectrum analysis (SSA) method, which is an efficient method of time series analysis that allows one to represent the complex structure of a series as a decomposition into simple components, such as trend, seasonal (periodic) fluctuations and noise.
The article describes a complete pipeline that uses data analysis for finding low-frequency lead/lag trading opportunities. It goes into building a cross-correlation-based Lead/Lag analyser step-by-step, with special attention to the most common errors beginners may commit while developing cross-asset diffusion queries. After screening dozens of cointegrated and correlated pairs, a trading candidate pair is chosen, and its tradeability is evaluated in a pure SQL backtest. Once it is qualified, the strategy is backtested on the MetaTester for parameter optimization. The Expert Advisor with respective backtest settings and optimization inputs is provided, along with Python and SQL scripts.
Although we can perform operations on a database containing about 10 records, the material is absorbed much better when we work with a file that contains more than 15 thousand records. That is, if we tried to create such a database manually, this task would be enormous. However, it is difficult to find such a database, even for educational purposes, that is available for download. But in reality, we don’t need to resort to that — we can use MetaTrader 5 to create a database for ourselves. In today's article, we will look at how to do this.
As we explained in the first article about SQL, there is no point in spending time programming procedures to do what is already built into SQL. However, without knowing the basics, you won’t be able to do anything with SQL or take full advantage of everything this tool offers. Therefore, in this article, we will look at how to perform basic tasks in databases.
It doesn't matter which SQL program we use: MySQL, SQL Server, SQLite, OpenSQL, or another. They all have something in common, and the common element is the SQL language. Even if we do not intend to use Workbench, we can manipulate or work with the database directly in MetaEditor or through MQL5 to perform actions in MetaTrader 5, but to do so, you will need knowledge of SQL. So here, we will learn at least the basics.
In this article, we will explore what pair trading is and how correlation trading works. We will also create an EA for automating pair trading and add the ability to automatically optimize this trading algorithm based on historical data. In addition, as part of the project, we will learn how to calculate the differences between two pairs using the z-score.
In this article, we develop a frequency analysis tool in MQL5 that bins price data into histograms, computes entropy for information content, and applies chi-square tests for distribution goodness-of-fit, with interactive logs and statistical panels for market insights. We integrate per-bar or per-tick computation modes, supersampled rendering for smooth visuals, and draggable/resizable canvases with auto-scrolling logs to enhance usability in trading analysis.
The implementation of the part of the code that will run in MetaTrader 5 does not present any difficulty. However, there are several points that need to be taken into account. This is necessary so that you can make the system work. Remember one important thing: not just one program will be running. In reality, we will have to run three programs simultaneously. It is important to implement and structure each of them in such a way that they can interact and communicate with one another, and that each of them understands what the others are trying or intending to do.
The Fibonacci retracement tool is an essential component of price action analysis, providing critical levels for potential market reactions. However, its effectiveness is often limited by the need for continuous human monitoring, which can lead to missed setups. In this part of our series, we introduce a tool that synchronizes and actively monitors manually drawn Fibonacci levels using MQL5, combining discretionary insight with automated oversight.
The article presents a comprehensive analysis of the Coral Reef Optimization (CRO) algorithm, a metaheuristic method inspired by the biological processes of coral reef formation and development. The algorithm models key aspects of coral evolution: broadcast spawning, brooding, larval settlement, asexual reproduction, and competition for limited reef space. Particular attention is paid to the improved version of the algorithm.
The article enhances an MQL5 footprint indicator with a compact box above each candle that summarizes net delta, total volume, and buy/sell percentages. We implement supersampled anti‑aliased rendering, rounded corners via arc and quadrilateral rasterization, and per‑pixel alpha compositing. Supporting utilities include ARGB conversion, scanline fills, and box‑filter downsampling. The box delivers fast sentiment reads that stay legible across zoom levels.
This article implements a regime-adaptive grid trading EA based on the PhD research of Aldo Taranto. It presents a regime‑adaptive grid trading EA that constrains risk through restartable cycles and equity‑based safeguards. We explain why naive grids fail (variance growth and almost‑sure ruin), derive the loss formula for real‑time exposure, and implement regime‑aware gating, ATR‑dynamic spacing, and a live kill switch. Readers get the mathematical tools and production patterns needed to build, test, and operate a constrained grid safely.
The article explores the Battle Royale Optimizer algorithm — a metaheuristic in which solutions compete with their nearest neighbors, accumulate “damage,” are replaced when a threshold is exceeded, and periodically shrink the search space around the current best solution. It presents both pseudocode and an MQL5 implementation of the CAOBRO class, including neighbor search, movement toward the best solution, and an adaptive delta interval. Test results on the Hilly, Forest, and Megacity functions highlight the strengths and limitations of the approach. The reader is provided with a ready-to-use foundation for experimentation and tuning key parameters such as popSize and maxDamage.
In this article, we expand the MQL5 graphing tool to support seventeen statistical distributions with interactive cycling via a header switch icon. We add type-specific data loading, discrete and continuous histogram computation, and theoretical density functions for each model, with dynamic titles, axis labels, and parameter panels that adapt automatically. The result lets you overlay distribution models on the same sample and compare fit across families without reloading the tool.
In this article, we enhance the 3D binomial distribution graphing tool in MQL5 by adding a segmented 3D curve for improved depth perception of the probability mass function, integrating pan mode for view target shifting, and implementing an interactive view cube with hover zones and animations for quick orientation changes. We incorporate clickable sub-zones on the view cube for faces, edges, and corners to animate camera transitions to standard views, while maintaining switchable 2D/3D modes, real-time updates, and customizable parameters for immersive probabilistic analysis in trading.
This article shows how to represent market structure as a graph in MQL5, turning swing highs/lows into nodes with features and linking them by edges. It trains a Graph Neural Network to score potential liquidity zones, exports the model to ONNX, and runs real-time inference in an Expert Advisor. Readers learn how to build the data pipeline, integrate the model, visualize zones on the chart, and use the signals for rule-based execution.
The alignment of higher-timeframe liquidity structures with lower-timeframe reversal patterns can greatly influence both the likelihood and direction of the next price movement. By integrating structural liquidity zones from higher timeframes with precise reversal confirmations on lower timeframes, traders can improve entry timing and overall trade quality. This article demonstrates how to reinforce liquidity-based trading strategies through higher-timeframe structural confirmation—and how to implement this approach effectively using MQL5.
The article outlines a practical data pipeline for quantitative analysis based on Parquet storage, Hive-style partitions, and DuckDB. It details migrating selected SQLite tables to Parquet, structuring market data by source, symbol, timeframe, and date, and querying it with SQL window functions. A Golden Cross example illustrates cross‑symbol evaluation of forward returns. Accompanying Python scripts handle data download, conversion, and execution.
This article explains why standard walkforward and k-fold CV inflate results on financial data, then shows how to fix it. V-in-V enforces strict data partitions and anchored walkforward across windows, CPCV purges and embargoes leakage while aggregating path-wise performance, and CSCV measures the Probability of Backtest Overfitting. Practitioners gain a coherent framework to assess regime robustness and selection reliability.
In this article, we advance the binomial distribution graphing tool in MQL5 by integrating DirectX for 3D visualization, enabling switchable 2D/3D modes with camera-controlled rotation, zoom, and auto-fitting for immersive analysis. We render 3D histogram bars, ground planes, and axes alongside the theoretical probability mass function curve, while preserving 2D elements like statistics panels, legends, and customizable themes, gradients, and labels
This article implements a box‑constrained Truncated Newton Conjugate‑Gradient (TNC) optimizer in MQL5 and details its core components: scaling, projection to bounds, line search, and Hessian‑vector products via finite differences. It provides an objective wrapper supporting analytic or numerical derivatives and validates the solver on the Rosenbrock benchmark. A logistic regression example shows how to use TNC as a drop‑in alternative to LBFGS.
This article develops an interactive MQL5 plot for the binomial distribution, combining a histogram of simulated outcomes with the theoretical probability mass function. It implements mean, standard deviation, skewness, kurtosis, percentiles, and confidence intervals, along with configurable themes and labels, and supports dragging, resizing, and live parameter changes. Use it to assess expected wins, likely drawdowns, and confidence ranges when validating trading strategies.
In this article, we enhance the regression graphing tool in MQL5 by adding a cyberpunk theme mode with neon glows, animations, and holographic effects for immersive visualization. We integrate theme toggling, dynamic backgrounds with stars, glowing borders, and neon points/lines, while maintaining standard mode compatibility. This dual-theme system elevates pair analysis with futuristic aesthetics, supporting real-time updates and interactions for engaging trading insights.
The article shows how to pair SQLite (OLTP) with DuckDB (OLAP) for statistical arbitrage data processing. DuckDB’s columnar engine, ASOF JOIN, and array functions accelerate core tasks such as quote–trade alignment and RWEC, with measured speedups from 2x to 23x versus SQLite on larger inputs. You get simpler queries and faster analytics while keeping trade execution in SQLite.
This article shows how to build an MQL5 indicator that reads a CSV trading history, extracts Profit($) values and total trades, and computes a cumulative balance progression. We plot the curve in a separate indicator window, auto-scale the Y-axis, and draw horizontal and vertical axes for alignment. The indicator updates on a timer and redraws only when new trades appear. Optional labels display per-trade profit and loss to help assess performance and drawdowns directly on the chart.
In this article, we enhance the hybrid Time Price Opportunity (TPO) market profile indicator in MQL5 by integrating volume data to calculate volume-based point of control, value areas, and volume-weighted average price with customizable highlighting options. The system introduces advanced features like initial balance detection, key level extension lines, split profiles, and alternative TPO characters such as squares or circles for improved visual analysis across multiple timeframes.
In this article, we create a canvas-based graphing tool in MQL5 for statistical correlation and linear regression analysis between two symbols, with draggable and resizable features. We incorporate ALGLIB for regression calculations, dynamic tick labels, data points, and a stats panel displaying slope, intercept, correlation, and R-squared. This interactive visualization aids in pair trading insights, supporting customizable themes, borders, and real-time updates on new bars
We are close to completing this challenge. However, before we begin, I want you to try to understand these two articles—this one and the previous one. That way, you will truly understand the next article, in which I will cover exclusively the part related to MQL5 programming. But I will also try to make it understandable. If you do not understand these last two articles, it will be difficult for you to understand the next one, because the material accumulates. The more things there are to do, the more you need to create and understand in order to achieve the goal.
In this article, we develop a custom indicator in MQL5 for hybrid Time Price Opportunity (TPO) market profiles, supporting multiple session timeframes such as intraday, daily, weekly, monthly, and fixed periods with timezone adjustments. The indicator quantizes prices into a grid, tracks session data including highs, lows, opens, and closes, and calculates key elements like the point of control and value area based on TPO counts. It renders profiles visually on the chart with customizable colors for TPO letters, single prints, value areas, POC, and close markers, enabling detailed session analysis
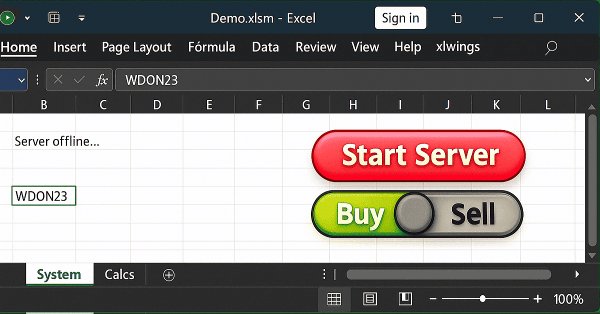
In this article, we will discuss one of the possible solutions to what we have been trying to demonstrate—namely, how to allow an Excel user to perform an action in MetaTrader 5 without sending orders or opening or closing positions. The idea is that the user employs Excel to conduct fundamental analysis of a particular symbol. And by using only Excel, they can instruct an expert advisor running in MetaTrader 5 to open or close a specific position.