Knowing how to input data from the Web into an Expert Advisor is not so obvious. It is not so easy to do without understanding all the possibilities offered by MetaTrader 5.
The article provides the foundations of a mathematically rigorous price movement and market functioning theory. Up to the present, we have not had any mathematically rigorous price movement theory. Instead, we have had to deal with experience-based assumptions stating that the price moves in a certain way after a certain pattern. Of course, these assumptions have been supported neither by statistics, nor by theory.
We continue to consider the clustering method. In this article, we will create a new CKmeans class to implement one of the most common k-means clustering methods. During tests, the model managed to identify about 500 patterns.
How to access online data via MetaTrader 5? There are a lot of websites and places on the web, featuring a huge amount information. What you need to know is where to look and how best to use this information.
It has been more than a year since I published my last article. This is quite a lot time to revise ideas and to develop new approaches. In the new article, I would like to divert from the previously used supervised learning method. This time we will dip into unsupervised learning algorithms. In particular, we will consider one of the clustering algorithms—k-means.
Decision trees imitate the way humans think to classify data. Let's see how to build trees and use them to classify and predict some data. The main goal of the decision trees algorithm is to separate the data with impurity and into pure or close to nodes.
Todays trader is a philomath who is almost always (either consciously or not...) looking up new ideas, trying them out, choosing to modify them or discard them; an exploratory process that should cost a fair amount of diligence. This clearly places a premium on the trader's time and the need to avoid mistakes. These series of articles will proposition that the MQL5 wizard should be a mainstay for traders. Why? Because not only does the trader save time by assembling his new ideas with the MQL5 wizard, and greatly reduce mistakes from duplicate coding; he is ultimately set-up to channel his energy on the few critical areas of his trading philosophy.
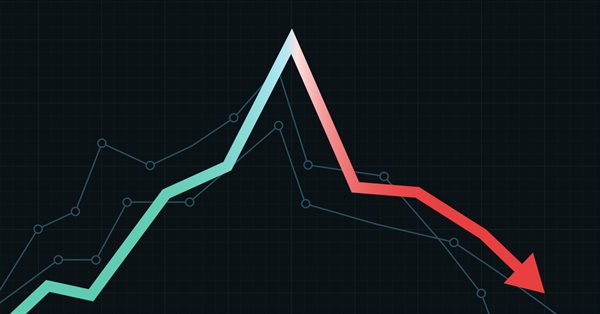
In this article I am going to attempt to use our logistic model to predict the stock market crash based upon the fundamentals of the US economy, the NETFLIX and APPLE are the stocks we are going to focus on, Using the previous market crashes of 2019 and 2020 let's see how our model will perform in the current dooms and glooms.
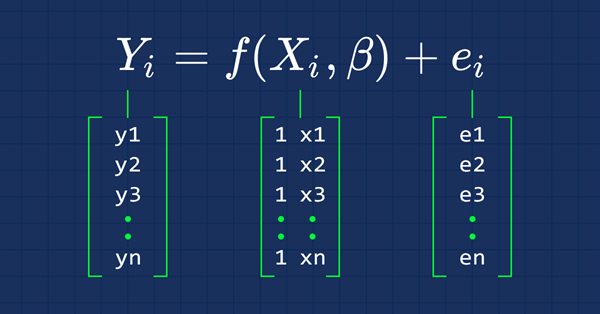
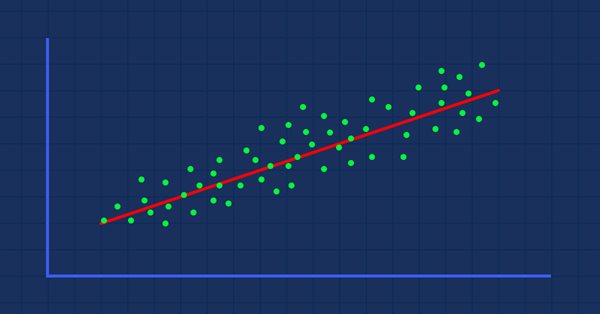
This time our models are being made by matrices, which allows flexibility while it allows us to make powerful models that can handle not only five independent variables but also many variables as long as we stay within the calculations limits of a computer, this article is going to be an interesting read, that's for sure.
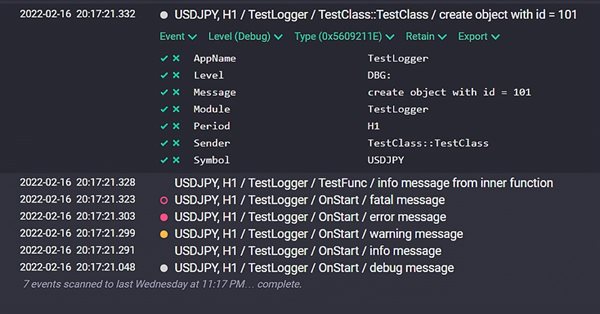
Implementation of the Logger class for unifying and structuring messages which are printed to the Experts log. Connection to the Seq log collection and analysis system. Monitoring log messages online.
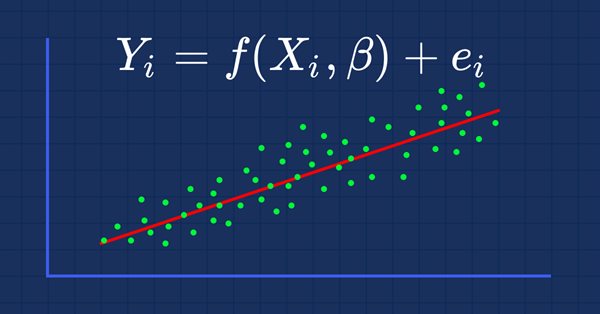
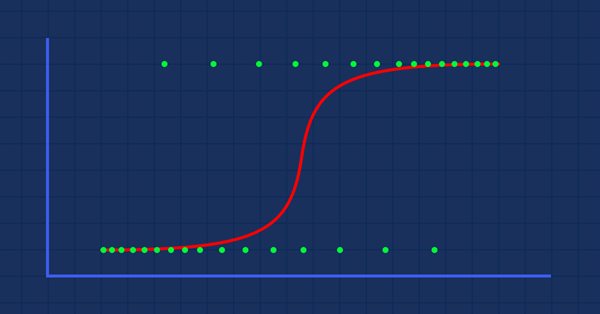
Data Classification is a crucial thing for an algo trader and a programmer. In this article, we are going to focus on one of classification logistic algorithms that can probability help us identify the Yes's or No's, the Ups and Downs, Buys and Sells.
Return on investments is the most obvious indicator which investors and novice traders use for the analysis of trading efficiency. Professional traders use more reliable tools to analyze strategies, such as Sharpe and Sortino ratios, among others.
It's time for us as traders to train our systems and ourselves to make decisions based on what number says. Not on our eyes, and what our guts make us believe, this is where the world is heading so, let us move perpendicular to the direction of the wave.
In this article, we will consider some of the essential points you should pay attention to when purchasing an Expert Advisor. We will also look for ways to increase profit, to spend money wisely, and to earn from this spending. Also, after reading the article, you will see that it is possible to earn even using simple and free products.
In this article, we will consider how to build graphs of all optimization passes and to select the optimal custom criterion. We will also see how to create a desired solution with little MQL5 knowledge, using the articles published on the website and forum comments.
This article presents an analysis of currency data to better understand why expert advisors can have good performance in some regions of time and poor performance in other regions of time.
In this article, I decided to conduct a study related to the possibility of reducing multiple states to double-state systems. The main purpose of the article is to analyze and to come to useful conclusions that may help in the further development of scalable trading algorithms based on the probability theory. Of course, this topic involves mathematics. However, given the experience of previous articles, I see that generalized information is more useful than details.
In this article, I decided to highlight the well-known Bernoulli scheme and to show how it can be used to describe trading-related data arrays. All this will then be used to create a self-adapting trading system. We will also look for a more generic algorithm, a special case of which is the Bernoulli formula, and will find an application for it.
There is a Python package available for developing integrations with MQL, which enables a plethora of opportunities such as data exploration, creation and use of machine learning models. The built in Python integration in MQL5 enables the creation of various solutions, from simple linear regression to deep learning models. Let's take a look at how to set up and prepare a development environment and how to use use some of the machine learning libraries.
A logical continuation of the earlier discussed topic would be the development of multifunctional mathematical models for trading tasks. In this article, I will describe the entire process related to the development of the first mathematical model describing fractals, from scratch. This model should become an important building block and be multifunctional and universal. It will build up our theoretical basis for further development of this idea.
In this article, we will continue to study fractals and will pay special attention to summarizing all the material. To do this, I will try to bring all earlier developments into a compact form which would be convenient and understandable for practical application in trading.
An indicator to report your brokers Bid/Ask spread levels. Now we can use MT5s tick data to analyze what the historic true average Bid/Ask spread actually have recently been. You shouldn't need to look at the current spread because that is available if you show both bid and ask price lines.
In this series of article, we will try to find a practical application of probability theory to describe trading and pricing processes. In the first article, we will look into the basics of combinatorics and probability, and will analyze the first example of how to apply fractals in the framework of the probability theory.
This is the first article in a series related to reversal patterns in the framework of algorithmic trading. We will begin with the most interesting pattern family, which originate from the Double Top and Double Bottom patterns.
This is the must read article for anyone wanting to improve their programming career. This article series is aimed at making you the best programmer you can possibly be, no matter how experienced you are. The discussed ideas work for MQL5 programming newbies as well as professionals.
Cluster analysis is one of the most important elements of artificial intelligence. In this article, I attempt applying the cluster analysis of the indicator slope to get threshold values for determining whether a market is flat or following a trend.
In this article, I will complete working with chart object classes and their collection. I will also implement auto tracking of changes in chart properties and their windows, as well as saving new parameters to the object properties. Such a revision allows the future implementation of an event functionality for the entire chart collection.
In this article, I will create the functionality for tracking some chart object events — adding/removing symbol charts and chart subwindows, as well as adding/removing/changing indicators in chart windows.
In this article, I will expand the functionality of chart objects and arrange navigation through charts, creation of screenshots, as well as saving and applying templates to charts. Also, I will implement auto update of the collection of chart objects, their windows and indicators within them.
The article provides the description of the technology aimed at increasing the effectiveness of any automated trading system. It provides a brief explanation of the idea, as well as its underlying basics, possibilities and disadvantages.
With this article, I start the development of the chart object collection class. The class will store the collection list of chart objects with their subwindows and indicators providing the ability to work with any selected charts and their subwindows or with a list of several charts at once.
In this article, I will continue the development of the chart object class. I will add the list of chart window objects featuring the lists of available indicators.
In this article, I will create the signal collection class of the MQL5.com Signals service with the functions for managing signals. Besides, I will improve the Depth of Market snapshot object class for displaying the total DOM buy and sell volumes.
In this article, I will create the collection class of Depths of Market of all symbols and start developing the functionality for working with the MQL5.com Signals service by creating the signal object class.
In this article, I will create two classes (the class of DOM snapshot object and the class of DOM snapshot series object) and test creation of the DOM data series.
This article describes the machine learning technique applied to grid and martingale trading. Surprisingly, this approach has little to no coverage in the global network. After reading the article, you will be able to create your own trading bots.
I continue filling the algorithm with the minimum necessary functionality and testing the results. The profitability is quite low but the articles demonstrate the model of the fully automated profitable trading on completely different instruments traded on fundamentally different markets.
In the article, I will start developing the functionality for working with the Depth of Market. I will also create the class of the Depth of Market abstract order object and its descendants.
Perhaps one of the most advanced models among currently existing language neural networks is GPT-3, the maximal variant of which contains 175 billion parameters. Of course, we are not going to create such a monster on our home PCs. However, we can view which architectural solutions can be used in our work and how we can benefit from them.