In this article, I will implement updating tick data in real time and prepare the symbol object class for working with Depth of Market (DOM itself is to be implemented in the next article).
Since a program may use different symbols in its work, a separate list should be created for each of them. In this article, I will combine such lists into a tick data collection. In fact, this will be a regular list based on the class of dynamic array of pointers to instances of CObject class and its descendants of the Standard library.
In this article, I will create the list for storing tick data of a single symbol and check its creation and retrieval of required data in an EA. Tick data lists that are individual for each used symbol will further constitute a collection of tick data.
It is impossible to get a truly stable algorithm if we use optimization based on historical data to select parameters. A stable algorithm should be aware of what parameters are needed when working on any trading instrument at any time. It should not forecast or guess, it should know for sure.
We have previously considered the mechanism of self-attention in neural networks. In practice, modern neural network architectures use several parallel self-attention threads to find various dependencies between the elements of a sequence. Let us consider the implementation of such an approach and evaluate its impact on the overall network performance.
In this article, I will continue the development of the topic by improving the flexibility of the previously created algorithm. The algorithm became more stable with an increase in the number of candles in the analysis window or with an increase in the threshold percentage of the overweight of falling or growing candles. I had to make a compromise and set a larger sample size for analysis or a larger percentage of the prevailing candle excess.
This article provides a continuation to the brute force topic, and it introduces new opportunities for market analysis into the program algorithm, thereby accelerating the speed of analysis and improving the quality of results. New additions enable the highest-quality view of global patterns within this approach.
The article considers the creation of machine learning models with time filters and discusses the effectiveness of this approach. The human factor can be eliminated now by simply instructing the model to trade at a certain hour of a certain day of the week. Pattern search can be provided by a separate algorithm.
In this article, I will try to test the assumption that any system with even a small understanding of the market can operate on a global scale. I will not invent any theories or patterns, but I will only use known facts, gradually translating these facts into the language of mathematical analysis.
We have already passed a long way and the code in our library is becoming bigger and bigger. This makes it difficult to keep track of all connections and dependencies. Therefore, I suggest creating documentation for the earlier created code and to keep it updating with each new step. Properly prepared documentation will help us see the integrity of our work.
In the upcoming series of articles, I will demonstrate the development of self-adapting algorithms considering most market factors, as well as show how to systematize these situations, describe them in logic and take them into account in your trading activity. I will start with a very simple algorithm that will gradually acquire theory and evolve into a very complex project.
In previous articles, we have already tested various options for organizing neural networks. We also considered convolutional networks borrowed from image processing algorithms. In this article, I suggest considering Attention Mechanisms, the appearance of which gave impetus to the development of language models.
From this article on, start creating library functionality to work with price data. Today, create an object class which will store all price data which arrived with yet another tick.
The article describes the basic principles and methods that allow you to analyze any strategy using spreadsheets (Excel, Calc, Google). The obtained results are compared with MetaTrader 5 tester.
In conclusion of the topic of working with timeseries organise storage, search and sort of data stored in indicator buffers which will allow to further perform the analysis based on values of the indicators to be created on the library basis in programs. The general concept of all collection classes of the library allows to easily find necessary data in the corresponding collection. Respectively, the same will be possible in the class created today.
This is the next article within the series, in which I show how I created a convenient library for manual application of chart graphics by utilizing keyboard shortcuts. The tools used include straight lines and their combinations. In this part, we will view how the drawing tools are applied using the functions described in the first part. The library can be connected to any Expert Advisor or indicator which will greatly simplify the charting tasks. This solution DOES NOT use external dlls, while all the commands are implemented using built-in MQL tools.
In this article we will continue discussing the brute force approach. I will try to provide a better explanation of the pattern using the new improved version of my application. I will also try to find the difference in stability using different time intervals and timeframes.
All traders visit the market with the goal of earning their first million dollars. How to do that without excessive risk and start-up budget? MQL5 services provide such opportunity for developers and traders from around the world.
In previous articles, we used stochastic gradient descent to train a neural network using the same learning rate for all neurons within the network. In this article, I propose to look towards adaptive learning methods which enable changing of the learning rate for each neuron. We will also consider the pros and cons of this approach.
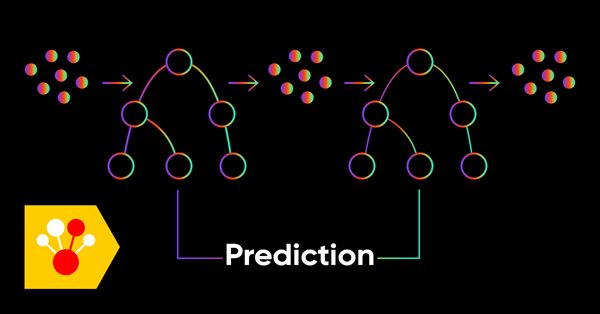
In this article, we will consider active machine learning methods utilizing real data, as well discuss their pros and cons. Perhaps you will find these methods useful and will include them in your arsenal of machine learning models. Transduction was introduced by Vladimir Vapnik, who is the co-inventor of the Support-Vector Machine (SVM).
We have previously considered various types of neural networks along with their implementations. In all cases, the neural networks were trained using the gradient decent method, for which we need to choose a learning rate. In this article, I want to show the importance of a correctly selected rate and its impact on the neural network training, using examples.
In this article, I will show the criteria to be used when selecting a system or a signal for investing your funds, as well as describe the optimal approach to the development of trading systems and highlight the importance of this matter in Forex trading.
In the article, develop an object which will contain all data of one buffer for one indicator. Such objects will be necessary for storing serial data of indicator buffers. With their help, it will be possible to sort and compare buffer data of any indicators, as well as other similar data with each other.
We have earlier discussed some types of neural network implementations. In the considered networks, the same operations are repeated for each neuron. A logical further step is to utilize multithreaded computing capabilities provided by modern technology in an effort to speed up the neural network learning process. One of the possible implementations is described in this article.
The article continues developing indicator object classes and their collections. For each indicator object create its description and correct collection class for error-free storage and getting indicator objects from the collection list.
We continue studying the world of neural networks. In this article, we will consider another type of neural networks, recurrent networks. This type is proposed for use with time series, which are represented in the MetaTrader 5 trading platform by price charts.
The article considers creation of classes of descendant objects of base abstract indicator. Such objects will provide access to features of creating indicator EAs, collecting and getting data value statistics of various indicators and prices. Also, create indicator object collection from which getting access to properties and data of each indicator created in the program will be possible.
In this article, we will search for market patterns, create Expert Advisors based on the identified patterns, and check how long these patterns remain valid, if they ever retain their validity.
The article considers creation of an abstract indicator which further will be used as the base class to create objects of library’s standard and custom indicators.
The article describes a method of fast optimization using the particle swarm algorithm. It also presents the method implementation in MQL, which is ready for use both in single-threaded mode inside an Expert Advisor and in a parallel multi-threaded mode as an add-on that runs on local tester agents.
As a continuation of the neural network topic, I propose considering convolutional neural networks. This type of neural network are usually applied to analyzing visual imagery. In this article, we will consider the application of these networks in the financial markets.
The article aims to describe the main features of Forex trading as simply and quickly as possible, as well as share some basic ideas with beginners. It also attempts to answer the most tantalizing questions in the trading community along with showcasing the development of a simple indicator.
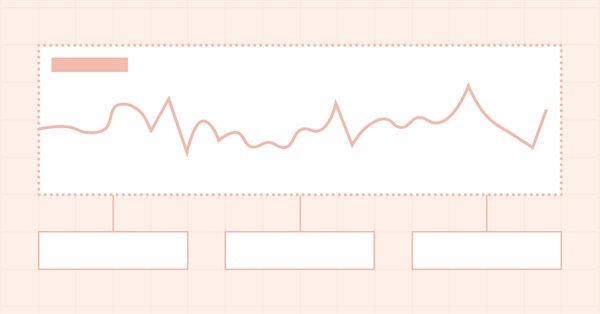
This article describes one of the possible approaches to data transformation aimed at improving the generalizability of the model, and also discusses sampling and selection of CatBoost models.
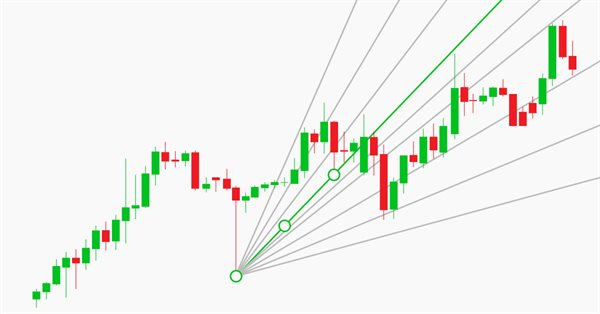
The article considers the methodology for developing trading algorithms, in which a consistent scientific approach is used to analyze possible price patterns and to build trading algorithms based on these patterns. Development ideals are demonstrated using examples.
In the article, let’s improve library methods for correct display of multi-symbol multi-period standard indicators, which lines are displayed on the current symbol chart with a shift set in the settings. As well, let’s put things in order in methods of work with standard indicators and remove the redundant code to the library area in the final indicator program.
In this second article, we will continue to study neural networks and will consider an example of using our created CNet class in Expert Advisors. We will work with two neural network models, which show similar results both in terms of training time and prediction accuracy.
Traders often talk about trends and flats but very few of them really understand what a trend/flat really is and even fewer are able to clearly explain these concepts. Discussing these basic terms is often beset by a solid set of prejudices and misconceptions. However, if we want to make profit, we need to understand the mathematical and logical meaning of these concepts. In this article, I will take a closer look at the essence of trend and flat, as well as try to define whether the market structure is based on trend, flat or something else. I will also consider the most optimal strategies for making profit on trend and flat markets.
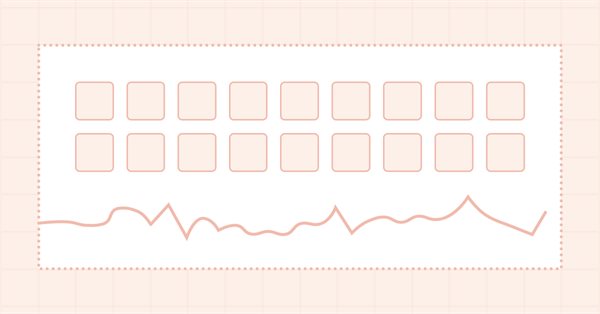
We usually analyze the market using candlesticks or bars that slice the price series into regular intervals. Doesn't such discretization method distort the real structure of market movements? Discretization of an audio signal at regular intervals is an acceptable solution because an audio signal is a function that changes over time. The signal itself is an amplitude which depends on time. This signal property is fundamental.
In the current article, I will improve the library classes to implement the ability to develop multi-symbol multi-period standard indicators requiring several indicator buffers to display their data.
The article considers an example of creating multi-symbol multi-period standard indicators using a single indicator buffer for construction and working in the indicator subwindow. I am going to prepare the library classes for working with standard indicators working in the program main window and having more than one buffer for displaying their data.