The amazing ability of weeds to survive in a wide variety of conditions has become the idea for a powerful optimization algorithm. IWO is one of the best algorithms among the previously reviewed ones.
In this article, I will consider the Firefly Algorithm (FA) optimization method. Thanks to the modification, the algorithm has turned from an outsider into a real rating table leader.
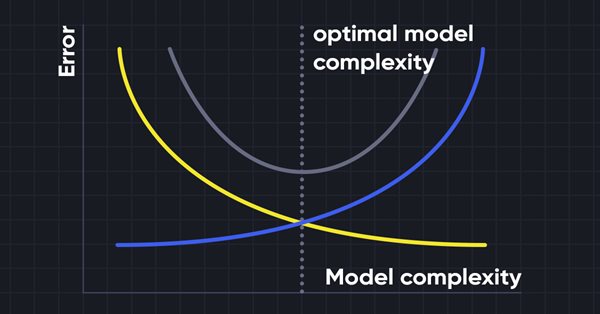
Machine learning has become a popular method for strategy development. Whilst there has been more emphasis on maximizing profitability and prediction accuracy , the importance of processing the data used to build predictive models has not received a lot of attention. In this article we consider using the concept of entropy to evaluate the appropriateness of indicators to be used in predictive model building as documented in the book Testing and Tuning Market Trading Systems by Timothy Masters.
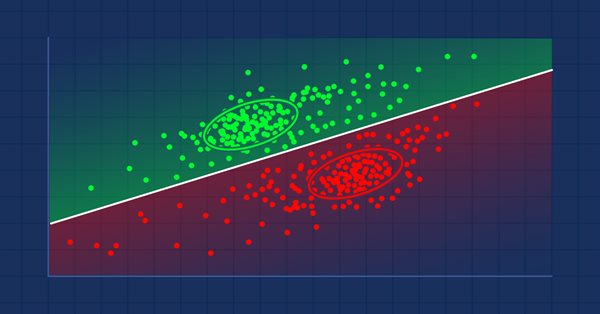
Matrix serves as the foundation of machine learning algorithms and computers in general because of their ability to effectively handle large mathematical operations, The Standard library has everything one needs but let's see how we can extend it by introducing several functions in the utils file, that are not yet available in the library
Fish School Search (FSS) is a new optimization algorithm inspired by the behavior of fish in a school, most of which (up to 80%) swim in an organized community of relatives. It has been proven that fish aggregations play an important role in the efficiency of foraging and protection from predators.
Category Theory is a diverse and expanding branch of Mathematics which as of yet is relatively uncovered in the MQL5 community. These series of articles look to introduce and examine some of its concepts with the overall goal of establishing an open library that attracts comments and discussion while hopefully furthering the use of this remarkable field in Traders' strategy development.
The next algorithm I will consider is cuckoo search optimization using Levy flights. This is one of the latest optimization algorithms and a new leader in the leaderboard.
Let's consider one of the newest modern optimization algorithms - Grey Wolf Optimization. The original behavior on test functions makes this algorithm one of the most interesting among the ones considered earlier. This is one of the top algorithms for use in training neural networks, smooth functions with many variables.
In this article, we will study the algorithm of an artificial bee colony and supplement our knowledge with new principles of studying functional spaces. In this article, I will showcase my interpretation of the classic version of the algorithm.
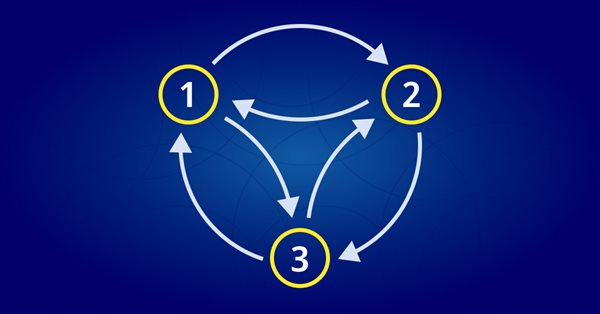
Markov chains are a powerful mathematical tool that can be used to model and forecast time series data in various fields, including finance. In financial time series modelling and forecasting, Markov chains are often used to model the evolution of financial assets over time, such as stock prices or exchange rates. One of the main advantages of Markov chain models is their simplicity and ease of use.
How do you like the idea of adding a new chart type to the MetaTrader 5 platform? Some people say it lacks a few things that other platforms offer. But the truth is, MetaTrader 5 is a very practical platform as it allows you to do things that can't be done (or at least can't be done easily) in many other platforms.
This time I will analyze the Ant Colony optimization algorithm. The algorithm is very interesting and complex. In the article, I make an attempt to create a new type of ACO.
Category Theory is a diverse and expanding branch of Mathematics which as of yet is relatively uncovered in the MQL community. These series of articles look to introduce and examine some of its concepts with the overall goal of establishing an open library that attracts comments and discussion while hopefully furthering the use of this remarkable field in Traders' strategy development.
Todays trader is a philomath who is almost always looking up new ideas, trying them out, choosing to modify them or discard them; an exploratory process that should cost a fair amount of diligence. These series of articles will proposition that the MQL5 wizard should be a mainstay for traders in this effort.
In this article, I will consider the popular Particle Swarm Optimization (PSO) algorithm. Previously, we discussed such important characteristics of optimization algorithms as convergence, convergence rate, stability, scalability, as well as developed a test stand and considered the simplest RNG algorithm.
This is a lazy algorithm that doesn't learn from the training dataset, it stores the dataset instead and acts immediately when it's given a new sample. As simple as it is, it is used in a variety of real-world applications.
We continue to study reinforcement learning. In this article, we will get acquainted with the Deep Q-Learning method. The use of this method has enabled the DeepMind team to create a model that can outperform a human when playing Atari computer games. I think it will be useful to evaluate the possibilities of the technology for solving trading problems.
We continue to study machine learning methods. With this article, we begin another big topic, Reinforcement Learning. This approach allows the models to set up certain strategies for solving the problems. We can expect that this property of reinforcement learning will open up new horizons for building trading strategies.
In the last two articles, we developed a tool for creating and editing neural network models. Now it is time to evaluate the potential use of Transfer Learning technology using practical examples.
In this article, I will show you how to calculate the total profit or loss of any trade, including commission and swap. I will provide the most accurate mathematical model and use it to write the code and compare it with the standard. Besides, I will also try to get on the inside of the main MQL5 function to calculate profit and get to the bottom of all the necessary values from the specification.
This is an introductory article on optimization algorithm (OA) classification. The article attempts to create a test stand (a set of functions), which is to be used for comparing OAs and, perhaps, identifying the most universal algorithm out of all widely known ones.
We continue to study unsupervised learning algorithms. This time I suggest that we discuss the features of autoencoders when applied to recurrent model training.
In the last article, we got acquainted with the Autoencoder algorithm. Like any other algorithm, it has its advantages and disadvantages. In its original implementation, the autoenctoder is used to separate the objects from the training sample as much as possible. This time we will talk about how to deal with some of its disadvantages.
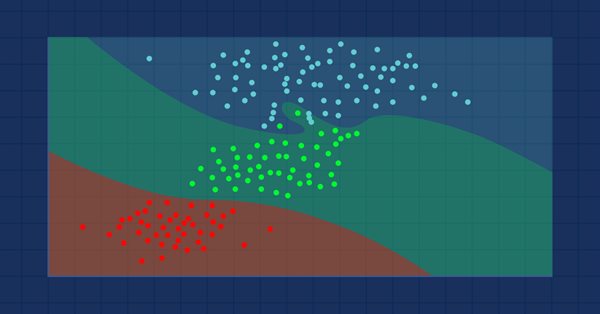
Unlike linear regression, polynomial regression is a flexible model aimed to perform better at tasks the linear regression model could not handle, Let's find out how to make polynomial models in MQL5 and make something positive out of it.
This article is about what you can not see in a backtest report, what you should expect using automated trading software, how to manage your money if you are using expert advisors, and how to cover a significant loss to remain in the trading activity when you are using automated procedures.
We continue to study unsupervised learning algorithms. Some readers might have questions regarding the relevance of recent publications to the topic of neural networks. In this new article, we get back to studying neural networks.
Matrices and vectors have been introduced in MQL5 for efficient operations with mathematical solutions. The new types offer built-in methods for creating concise and understandable code that is close to mathematical notation. Arrays provide extensive capabilities, but there are many cases in which matrices are much more efficient.
The article considers the probabilistic price field evolution equation and the upcoming price spike criterion. It also reveals the essence of price values on charts and the mechanism for the occurrence of a random walk of these values.
We continue considering association rules. In the previous article, we have discussed theoretical aspect of this type of problem. In this article, I will show the implementation of the FP Growth method using MQL5. We will also test the implemented solution using real data.
As a continuation of this series of articles, let's consider another type of problems within unsupervised learning methods: mining association rules. This problem type was first used in retail, namely supermarkets, to analyze market baskets. In this article, we will talk about the applicability of such algorithms in trading.
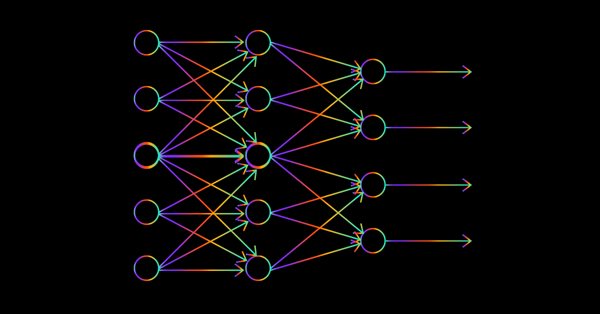
There are minor things to cover on the feed-forward neural network before we are through, the design being one of them. Let's see how we can build and design a flexible neural network to our inputs, the number of hidden layers, and the nodes for each of the network.
Metamodels in machine learning: Auto creation of trading systems with little or no human intervention — The model decides when and how to trade on its own.
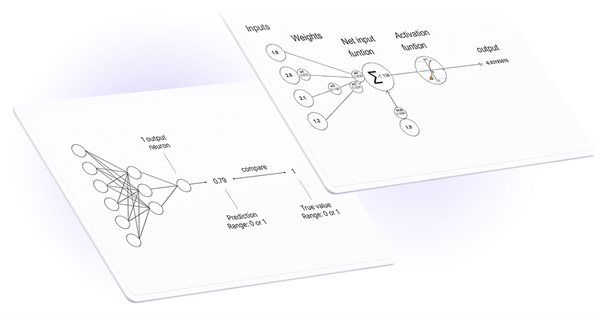
Many people love them but a few understand the whole operations behind Neural Networks. In this article I will try to explain everything that goes behind closed doors of a feed-forward multi-layer perception in plain English.
In this part we continue discussing Artificial Intelligence models. Namely, we study unsupervised learning algorithms. We have already discussed one of the clustering algorithms. In this article, I am sharing a variant of solving problems related to dimensionality reduction.
In this article we continue considering how to obtain data from the web and to use it in an Expert Advisor. This time we will proceed to developing an alternative system.
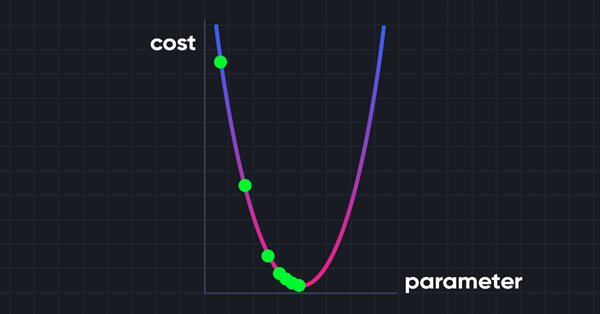
The gradient descent plays a significant role in training neural networks and many machine learning algorithms. It is a quick and intelligent algorithm despite its impressive work it is still misunderstood by a lot of data scientists let's see what it is all about.
In the previous article, we have created a class for data clustering. In this article, I want to share variants of the possible application of obtained results in solving practical trading tasks.