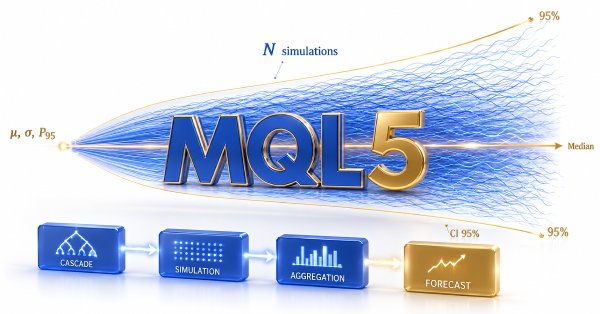
We implement the CMonteCarlo module that turns the fitted MMAR parameters into a volatility forecast via Monte Carlo. It runs N independent simulations over a chosen horizon and reports mean, median, standard deviation, and a percentile-based 95% confidence interval, with access to per-run values if needed. Adaptive cascade depth selects the minimal k such that b^k covers the horizon, keeping the run fast and consistent.
MetaTrader 5 provides no native tool for visualizing intraday return patterns across time dimensions simultaneously. This article implements a custom indicator that aggregates historical bar returns into a 5×24 matrix indexed by weekday and hour of day, then renders the result as a color-interpolated heatmap inside an indicator subwindow using CCanvas. Green cells represent positive average returns, red cells negative, with color intensity encoding return magnitude.
We integrate eleven one-minute microstructure measurements from Parts 2–6 into a composite regime label with confidence and direction. A rule-based RegimeClassifier() assigns one of six regimes—Normal, Stressed, Noisy, Informed, Trending, Mean-Reverting—using empirically derived thresholds from 514 NQ M1 sessions (May 2024–May 2026). The deliverable includes MARKET_REGIME, RegimeAnalysis, and PopulateRegimeAnalysis(), enabling position sizing, stop placement, and signal filtering from a single call.
The article explores the revolutionary Mamba/SSM neural network architecture for financial time series forecasting. We will consider a complete MQL5 implementation of a modern alternative to Transformer with linear complexity O(N) instead of quadratic O(N²). Selective State Space Models, hardware-aware optimizations, patching techniques, and advanced AdamW training methods are covered in detail. Practical test results showing an increase in accuracy from 62% to 71% while reducing training time from 45 to 8 minutes are included. A ready-made trading EA with auto learning and adaptive risk management for MetaTrader 5 is presented.
The article establishes a reproducible method to measure portfolio risk for multiple symbols using MQL5 matrices and OpenBLAS. It covers computing log returns, building a covariance matrix, and evaluating wᵀΣw instead of summing individual variances. A complete script prints naive versus true volatility and the cross‑term contribution, enabling you to detect when correlated instruments inflate exposure beyond single‑asset estimates.
A lightweight persistence design lets EAs retain counters, flags, and timestamps between terminal restarts. Using only MQL5, CPersistentStore writes a human-readable key=value file in MQL5/Files and serves reads from a CHashMap write-through cache via a typed API. The article analyzes O(1)/O(n) operations, partial‑write risks, and lack of locking, compares with GlobalVariables/SQLite, and provides a demo that reloads state deterministically.
Trading is characterized by high demands on risk management discipline. The article presents an analysis of the main reasons for traders' failures and proposes a technical solution in the form of the CEnhancedRiskManager class for the MQL5 platform. It includes practical testing on an aggressive grid EA.
This article lays out 'CMoneyKDTreeESN' custom money management class usable with the MQL5 Wizard, that combines the KD-Tree algorithm and the Echo State Network. We use the KD-Tree on log returns and ATR to give us a risk score, while the ESN tracks recent flow to give us a bounded lot size multiplier. Our class is usable in a variety of Wizard assembled Expert Advisors as shown here with the Envelopes and RSI signals, with a broad objective of modulating exposure in high-volatility and tail-risk environments.
This article demonstrates how to build a reusable prop‑firm evaluation module for MQL5 Expert Advisors and export results to an HTML dashboard. The module monitors balance and equity during backtests, simulates single or rolling challenges, checks profit target, daily and overall drawdown, and minimum trading days, then outputs both a terminal summary and a browser‑readable report.
In this section, we will look at the implementation of the key interfaces of the library of Gaussian processes in MQL5: IKernel, ILikelihood, and IInference. We will also demonstrate its operation on synthetic data and implement indicators for classification and regression, demonstrating its operation in online mode - with retraining of the model on each new bar.
The article implements rolling OLS regression channels in MQL5 and computes confidence and prediction bands with Student's t critical values instead of a fixed standard-deviation multiplier. It explains the leverage-driven widening at window edges, contrasts the result with Bollinger and Donchian channels, and reviews OLS assumptions on price data. A five-line rendering is documented to ensure reliable display in MetaTrader 5.
We add a tabbed settings window opened from the ribbon and bound to the selected object. The tabs — Style, Text, Coordinates, and Visibility — are built from the same descriptor system, with scrolling, per-level rows, and shared color/width/style popovers. The article covers layout, rendering, interaction, and inline price/time and numeric editing. You get one place to edit every property with live preview and commit-or-discard on close.
We turn a price-embedded point cloud into a Vietoris–Rips filtration and its boundary matrix. The article enumerates vertices, edges, and triangles with filtration values, sorts them in entry order, and builds O(1) vertex/edge lookups. You get MQL5 classes CTDARips and CTDABoundary and a sparse Z/2 boundary suitable for the next-step persistence reduction.
The article describes implementation of the A3 algorithm - a metaheuristic optimization method inspired by chemical processes - in MQL5. Only two adjustable parameters, compactness and a small population, ensure high operating speed with sufficient quality of solutions.
The article focuses on creating a trading system with a real quantum simulator instead of mathematical analogies. The system uses 3 virtual qubits, quantum gates and superposition principles to analyze markets. It is implemented as a trading EA for MetaTrader 5 in MQL5. The main achievement is the transition from simulation to real quantum principles of financial information processing.
This article presents 'CSignalUKFCapsNet', as a custom class coded in MQL5. This class is meant to be used with the MQL5 Wizard when assembling an Expert Advisor and when selected in the Wizard it defines the Expert Advisor's entry signals. In building this custom class, we brought together the algorithm Unscented Kalman Filter and the Capsule Neural Network. Our algorithm is showcased with four operation modes, and the coding of this as a custom class for the MQL5 Wizard, allows testing with various Trailing Stop methods and Money Management systems.
This article introduces a frequency-analysis framework for encoded candlestick patterns in MQL5. By transforming candlesticks into alphabetic symbols, historical price action can be analyzed as a statistical sequence rather than a visual chart. Using GBPUSD and Gold across multiple timeframes, the study examines the occurrence frequency of individual candlestick types, identifies dominant market structures, and reveals the symmetry between bullish and bearish price movements. The results establish a quantitative foundation for pattern discovery and prepare the way for analyzing multi-candlestick sequences and their predictive potential in algorithmic trading systems.
This article describes a live data export framework for MetaTrader 5 built around a decoupled, three‑layer design. The MQL5 component batches bar and tick records via a write buffer and rotates CSV files daily; a Python daemon tails the stream, renders a live dashboard, and flags anomaly thresholds. The demo indicator illustrates integration points, enabling real‑time monitoring and auditability during trading sessions.
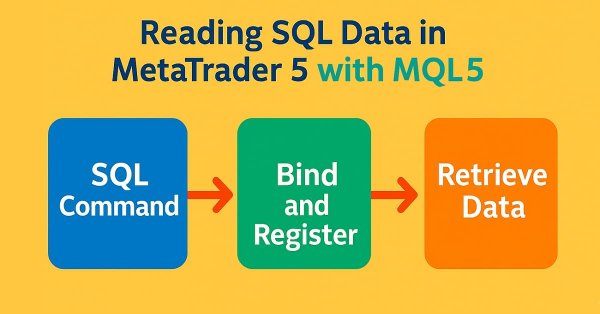
In the previous article, I showed how to proceed in order to add a query mechanism. This was needed so that, inside MQL5 code, you could fully use SQL and retrieve results using an SQL SELECT query. But there is still one last function we need to implement. This is the DatabaseReadBind function. Since understanding it properly requires a slightly more detailed explanation, it was decided to cover it not in the previous article, but in today's article. So, since the topic will be fairly extensive, let us proceed directly to the next section.
We resume the topic of optimization by the scientific community. CoSO should not be viewed as a ready-made solution, but as a promising research platform. With proper development, CoSO can find its niche in tasks where adaptability and resilience to change are important, and computation time is not critical.
This article adds six order-flow functions and a new OrderFlowAnalysis struct to MicroStructureFoundation.mqh: VPINOHLC, signed flow imbalance, trade intensity versus a 20-session baseline, a late-minus-early smart-money index, flow momentum, and a wrapper that outputs a confidence weight. Flow confidence is gated by noise and jump intensity from Parts 5 and 4. Calibrated on 602 NQ M1 NY sessions, it provides ready-to-use intraday flow signals with documented thresholds.
This article extends the chart‑object detector into a modular monitoring and execution layer. It defines objective interaction rules (touch, cross, breakout) for trendlines, Fibonacci levels, channels, rectangles, and pitchforks, then routes events through an interaction detector, alert manager, and optional trade executor. Orders use object geometry for stop‑loss and take‑profit. The result is a reproducible pipeline that converts static drawings into actionable alerts and, if enabled, trades.
This article implements the MMAR Simulation Engine that turns fitted parameters (H, distribution, coefficients, sample volatility) into synthetic price paths. It builds multifractal trading time via a multiplicative cascade, synthesizes fractional Brownian motion with Davies–Harte or Cholesky, scales it to target volatility, and composes the process by time deformation. Readers get a reusable MQL5 class, method choices by path length, and validation steps for scenario testing and Monte Carlo use in the next part.
This article presents a custom MetaTrader 5 indicator that computes a rolling annualized Sharpe ratio and plots configurable z-score significance bands based on Lo's asymptotic standard error. It uses a circular return buffer with incremental variance to keep O(1) updates. We explain the n^(-1/2) uncertainty scaling, the inflation of intervals at high Sharpe values, and how to set per-instrument annualization for correct deployment.
The article presents an innovative quantum neural network architecture for algorithmic trading that combines the principles of quantum mechanics with modern machine learning methods. The system includes quantum effects (resonance, interference, decoherence), multi-level memory of different time scales, Markov chains with the ALGLIB library, and adaptive parameter control. The full implementation is done in MQL5 using the built-in matrix/vector types, which removes implementation barriers in MetaTrader 5.
For this article we look at a custom MQL5 Wizard class for Trailing Stops. Our implemented custom class ‘CTrailingConvexHullGRU’, is built from merging the Convex Hull algorithm with a GRU network. As always we seek to develop a model that is testable with MQL5 Wizard-Assembled Expert Advisors and can be tuned with various Money Management and entry Signals classes. Our testing is with the 'Envelopes' and the RSI classes for Signal.
Many people tend to underestimate SQL, or even not use it at all, because they do not fully understand how it actually works. When running queries against an SQL database, we are not always looking for a universal answer; in some cases, we need a very specific and practical answer. If a database is created with a proper structure and data model, almost any type of information can be integrated into it.
Secrets of effective optimization of trading strategies in metaheuristic approaches. Community of Scientists Optimization is a new population-based algorithm inspired by the mechanisms of the scientific community. Unlike traditional nature-inspired metaphors, CoSO models unique aspects of human scientific activity: publishing results in journals, competing for grants, and forming research teams.
The article presents a practical foundation for shape analysis of price series in MQL5. It implements Takens time‑delay embedding to build a phase‑space point cloud and computes the full pairwise distance matrix under selectable norms. The CTDAPointCloud and CTDADistance classes are provided with a demo script that embeds chart data and outputs results, preparing inputs for downstream topological tools.
We add a descriptor-driven property stack and a floating ribbon that binds to the current selection on the drawing layer. The article covers the descriptor list for each tool, the engine get/set API with snapshot-and-restore live preview, and widget renderers for color, opacity, line width, line style, fonts, and level visibility. You get in-place, real-time editing of object appearance via a compact, draggable panel.
This article shows how to build a hands-free trading workflow for MetaTrader 5 by translating webcam-tracked hand gestures into MQL5 trade commands. We cover the architecture (MediaPipe/OpenCV in Python plus an MQL5 EA), gesture-to-action mapping, and interprocess communication via Global Variables or HTTP polling. You will implement the EA, execute BUY/SELL/CLOSE actions, and validate latency and reliability under real‑time conditions.
In this article we consider a custom MQL5 Wizard class that processes Money Management. Our custom class is labelled ‘CMoneyWaveletLSTM’, and is developed by combining the Wavelet Thresholding algorithm with an LSTM network. As has been the case throughout these series, the developed model is testable with MQL5 Wizard-Assembled Expert Advisors that can be tuned with different trailing stops and entry Signals classes. We maintain our entry Signal, as in past articles as the built-in 'Envelopes' class and the RSI class.
Direct calls to the MQL5 History API inside analytics components create hidden terminal dependencies that make isolated testing structurally impossible. This article constructs an ITradeRepository abstraction layer with CLiveTradeRepository and CMockTradeRepository implementations, enabling the same analytics engine and equity curve panel to operate identically against live account data or a deterministic in-memory dataset. Repository injection eliminates direct API coupling, supports offline validation, and confines data source changes to a single implementation class.
The article presents the Competitive Learning Algorithm (CLA), a new metaheuristic optimization method based on simulating the educational process. The algorithm organizes the population of solutions into classes with students and teachers, where agents learn through three mechanisms: following the best in the class, using personal experience, and sharing knowledge between classes.
The article considers the classification model of Gaussian processes. We will start by studying its theoretical principles moving on to the practical development of the GP library in MQL5.
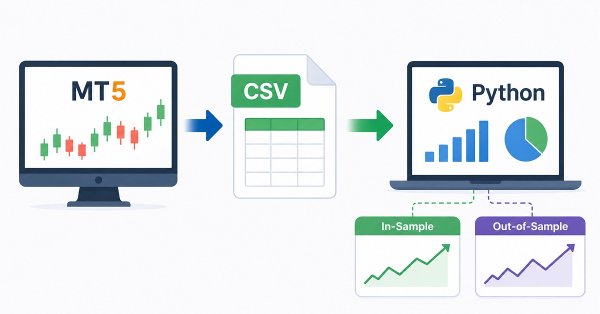
The article presents a reproducible MetaTrader 5 to Python pipeline for large-scale indicator research. An MQL5 export schema captures fixed columns, including custom lag and whipsaw counters. A baseline module performs parameter-matched comparisons across symbols and timeframes, while a walk-forward module locks the InSample optimum and evaluates it on unseen data. Readers gain unbiased robustness measurements and automation that removes manual selection bias.
We add eight shape tools and nine annotation tools to the canvas and implement a full in-place label-editing system. The article walks through geometry, AA rendering, shared word-wrap and supersampled text helpers, and the caret-driven state machine for typing, navigation, and selection. This yields a complete, consistent annotation toolkit with editable labels that plugs into the prior interaction pipeline.
The article extends MicroStructure_Foundation.mqh with a MicrostructureAnalysis struct and five functions that decompose M1 price variation into a quoted spread proxy, Roll-implied spread, OHLC-based noise ratio, order imbalance, and an adverse selection component. A wrapper populates these fields and links them to the volatility suite from Part 4. Empirical thresholds come from 602 NQ E-mini NY sessions (Jan 2024–Jun 2026), helping you gate volatility signals, size risk, and recognize spread-driven frictions.
MetaTrader 5 provides rich performance data but limited structural analysis. This article shows how to export results to CSV from MQL5 and build five Python visualizations that expose cross-asset parameter consistency, the lag‑versus‑noise trade-off, walk‑forward decay, drawdown depth and duration, and intraday hour‑by‑day clusters. A unified automation module runs the full pipeline on any new export to deliver repeatable diagnostics.
For this article we switch to a custom MQL5 Wizard class that examines entry Signals. Our custom class is ‘CSignalDSUDBN’ this time around, and is coded by combining the Disjoint Set Union algorithm with a Deep Belief network. As has been the case throughout these series, our model is testable with MQL5 Wizard-Assembled Expert Advisors that can be tuned with different trailing stops and money management classes.