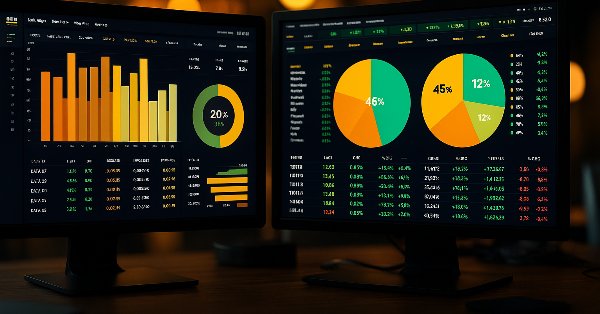
This article explores the development of a Market Entropy Indicator based on principles from Information Theory to measure the uncertainty and information content within financial markets. By applying concepts such as Shannon Entropy to price movements, the indicator quantifies whether the market is structured (trending), transitioning, or chaotic.
The article explores the Battle Royale Optimizer algorithm — a metaheuristic in which solutions compete with their nearest neighbors, accumulate “damage,” are replaced when a threshold is exceeded, and periodically shrink the search space around the current best solution. It presents both pseudocode and an MQL5 implementation of the CAOBRO class, including neighbor search, movement toward the best solution, and an adaptive delta interval. Test results on the Hilly, Forest, and Megacity functions highlight the strengths and limitations of the approach. The reader is provided with a ready-to-use foundation for experimentation and tuning key parameters such as popSize and maxDamage.
This article implements a box‑constrained Truncated Newton Conjugate‑Gradient (TNC) optimizer in MQL5 and details its core components: scaling, projection to bounds, line search, and Hessian‑vector products via finite differences. It provides an objective wrapper supporting analytic or numerical derivatives and validates the solver on the Rosenbrock benchmark. A logistic regression example shows how to use TNC as a drop‑in alternative to LBFGS.
Built on lower-timeframe market structure, and then orchestrated on the higher-timeframe, this indicator detects swing extremes where price becomes statistically vulnerable to reversal. It visualizes overextension and pullback zones, offering early insight into mean-reversion behavior.
The article extends a liquidity-based strategy with a simple trend constraint: trade liquidity zones only in the direction of the EMA(50). It explains filtering rules, presents a reusable TrendFilter.mqh class and EA integration in MQL5, and compares baseline versus filtered tests. Readers gain a clear directional bias, reduced overtrading in countertrend phases, and ready-to-use source files.
We are close to completing this challenge. However, before we begin, I want you to try to understand these two articles—this one and the previous one. That way, you will truly understand the next article, in which I will cover exclusively the part related to MQL5 programming. But I will also try to make it understandable. If you do not understand these last two articles, it will be difficult for you to understand the next one, because the material accumulates. The more things there are to do, the more you need to create and understand in order to achieve the goal.
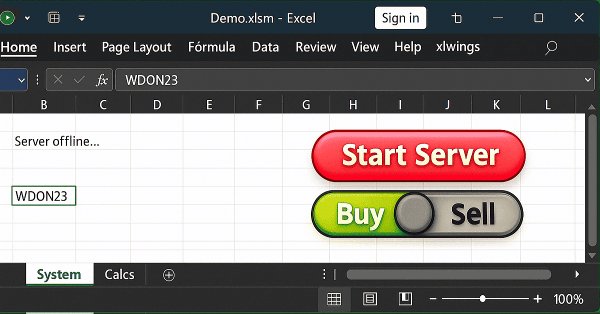
In this article, we will discuss one of the possible solutions to what we have been trying to demonstrate—namely, how to allow an Excel user to perform an action in MetaTrader 5 without sending orders or opening or closing positions. The idea is that the user employs Excel to conduct fundamental analysis of a particular symbol. And by using only Excel, they can instruct an expert advisor running in MetaTrader 5 to open or close a specific position.
When we develop something in xlwings or any other package that allows reading and writing directly to Excel, we must note that all programs, functions, or procedures execute and then complete their task. They do not remain in a loop, no matter how hard we try to do things differently.
In this article, we explore the File Operations classes of the MQL5 Standard Library to build a robust reporting module that automatically generates Excel-ready CSV files. Along the way, we clearly distinguish between manually executed trades and algorithmically executed orders, laying the groundwork for reliable, auditable trade reporting.
We revisit the Ilan grid Expert Advisor and integrate Q-learning in MQL5 to build an adaptive version for MetaTrader 5. The article shows how to define state features, discretize them for a Q-table, select actions with ε-greedy, and shape rewards for averaging and exits. You will implement saving/loading the Q-table, tune learning parameters, and test on EURUSD/AUDUSD in the Strategy Tester to evaluate stability and drawdown risks.
Liquidity zones are commonly traded by waiting for the price to return and retest the zone of interest, often through the placement of pending orders within these areas. In this article, we leverage MQL5 to bring this concept to life, demonstrating how such zones can be identified programmatically and how risk management can be systematically applied. Join the discussion as we explore both the logic behind liquidity-based trading and its practical implementation.
Building on the previous article that introduced the market state classification module, this installment focuses on implementing the core logic for identifying and evaluating compression zones. It presents a range contraction detection and maturity grading system in MQL5 that analyzes market congestion using price action alone.
In this article, we write an example of visualizing the optimization process and display the top three passes for the four optimization criteria. We will also provide an opportunity to select one of the three best passes for displaying its data in tables and on a chart.
The new proprietary optimization algorithm NOA2 (Neuroboids Optimization Algorithm 2) combines the principles of swarm intelligence with neural control. NOA2 combines the mechanics of a neuroboid swarm with an adaptive neural system that allows agents to self-correct their behavior while searching for the optimum. The algorithm is under active development and demonstrates potential for solving complex optimization problems.
This article develops a market state classification module for MQL5 that interprets price behavior using completed price data. By examining volatility contraction, expansion, and structural consistency, the tool classifies market conditions as compression, transition, expansion, or trend, providing a clear contextual framework for price action analysis.
In this discussion, we follow up on the previously developed multi-signal Expert Advisor with the objective of exploring and applying available optimization methods. The aim is to determine whether the trading performance of the EA can be meaningfully improved through systematic optimization based on historical data.
This article presents a session-based analytical framework that combines time-defined market sessions with the Candle Pressure Index (CPI) to classify acceptance and rejection behavior at session boundaries using closed-candle data and clearly defined rules.
In this discussion, we will develop an indicator to identify price zones created by strong market activity, such as impulsive moves, structure shifts, and liquidity events. These zones represent areas where the market has left “memory” due to unfilled orders or rapid price displacement. By marking these regions on the chart, the indicator highlights where price is statistically more likely to revisit and react in the future.
In this article, we will continue to connect the new strategy to the created auto optimization system. Let's look at what changes need to be made to the optimization project creation EA, as well as the second and third stage EAs.
This article explores a method that combines Heikin‑Ashi smoothing with EMA20 High and Low boundaries and an EMA50 trend filter to improve trade clarity and timing. It demonstrates how these tools can help traders identify genuine momentum, filter out noise, and better navigate volatile or trending markets.
In this article, we introduce functions similar to those provided by the Python-MetaTrader 5 module, providing a simulator with a familiar interface and a custom way of handling bars and ticks internally.
A new bioinspired optimization metaheuristic, NOA (Neuroboids Optimization Algorithm), combines the principles of collective intelligence and neural networks. Unlike conventional methods, the algorithm uses a population of self-learning "neuroboids", each with its own neural network that adapts its search strategy in real time. The article reveals the architecture of the algorithm, the mechanisms of self-learning of agents, and the prospects for applying this hybrid approach to complex optimization problems.
Successful Restaurateur Algorithm (SRA) is an innovative optimization method inspired by restaurant business management principles. Unlike traditional approaches, SRA does not discard weak solutions, but improves them by combining with elements of successful ones. The algorithm shows competitive results and offers a fresh perspective on balancing exploration and exploitation in optimization problems.
The BOA method is inspired by the classic game of billiards and simulates the search for optimal solutions as a game with balls trying to fall into pockets representing the best results. In this article, we will consider the basics of BOA, its mathematical model, and its efficiency in solving various optimization problems.
In this article, we will look at how to connect a new strategy to the auto optimization system we have created. Let's see what kind of EAs we need to create and whether it will be possible to do without changing the EA library files or minimize the necessary changes.
The article presents a new metaheuristic algorithm, Chaos Game Optimization (CGO), which demonstrates a unique ability to maintain high efficiency when dealing with high-dimensional problems. Unlike most optimization algorithms, CGO not only does not lose, but sometimes even increases performance when scaling a problem, which is its key feature.
Trading without session awareness is like navigating without a compass—you're moving, but not with purpose. Today, we're revolutionizing how traders perceive market timing by transforming ordinary charts into dynamic geographical displays. Using MQL5's powerful visualization capabilities, we'll build a live world map that illuminates active trading sessions in real-time, turning abstract market hours into intuitive visual intelligence. This journey sharpens your trading psychology and reveals professional-grade programming techniques that bridge the gap between complex market structure and practical, actionable insight.
We aim to create a system for automatic periodic optimization of trading strategies used in one final EA. As the system evolves, it becomes increasingly complex, so it is necessary to look at it as a whole from time to time in order to identify bottlenecks and suboptimal solutions.
Sockets. Do you know what they are for or how to use them in MetaTrader 5? If the answer is no, let's start by studying them. In today's article, we'll cover the basics. Since there are several ways to do the same thing, and we are always interested in the result, I want to show that there is indeed a simple way to transfer data from MetaTrader 5 to other programs, such as Excel. However, the main idea is not to transfer data from MetaTrader 5 to Excel, but the opposite, that is, to transfer data from Excel or any other program to MetaTrader 5.
We continue our new series on Market-Positioning, where we study particular assets, with specific trade directions over manageable test windows. We started this by considering Nvidia Corp stock in the last article, where we covered 5 signal patterns from the complimentary pairing of the RSI and DeMarker oscillators. For this article, we cover the remaining 5 patterns and also delve into multi-pattern options that not only feature untethered combinations of all ten, but also specialized combinations of just a pair.
Many people, especially non=programmers, find it very difficult to transfer information between MetaTrader 5 and other programs. One such program is Excel. Many use Excel as a way to manage and maintain their risk control. It is an excellent program and easy to learn, even for those who are not VBA programmers. Here we will look at how to establish a connection between MetaTrader 5 and Excel (a very simple method).
We commence a new article series that builds upon our earlier efforts laid out in the MQL5 Wizard series, by taking them further as we step up our approach to systematic trading and strategy testing. Within these new series, we’ll concentrate our focus on Expert Advisors that are coded to hold only a single type of position - primarily longs. Focusing on just one market trend can simplify analysis, lessen strategy complexity and expose some key insights, especially when dealing in assets beyond forex. Our series, therefore, will investigate if this is effective in equities and other non-forex assets, where long only systems usually correlate well with smart money or institution strategies.
I present to you my new population optimization algorithm - Blood Inheritance Optimization (BIO), inspired by the human blood group inheritance system. In this algorithm, each solution has its own "blood type" that determines the way it evolves. Just as in nature where a child's blood type is inherited according to specific rules, in BIO new solutions acquire their characteristics through a system of inheritance and mutations.
If we are going to automate periodic optimization, we need to think about auto updates of the settings of the EAs already running on the trading account. This should also allow us to run the EA in the strategy tester and change its settings within a single run.
The article presents a new metaheuristic optimization Circle Search Algorithm (CSA) based on the geometric properties of a circle. The algorithm uses the principle of moving points along tangents to find the optimal solution, combining the phases of global exploration and local exploitation.
In this article, I will explain how Chart Trade, together with the Expert Advisor, will process a request to close all of the users' open positions. This may sound simple, but there are a few complications that you need to know how to manage.
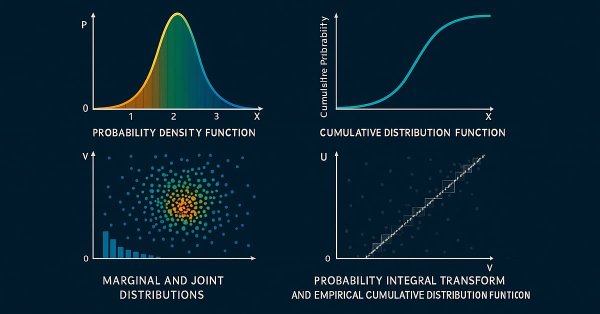
This is the first part of an article series presenting the implementation of bivariate copulae in MQL5. This article presents code implementing Gaussian and Student's t-copulae. It also delves into the fundamentals of statistical copulae and related topics. The code is based on the Arbitragelab Python package by Hudson and Thames.
Often we have to take a step back and then move forward. In this article, we will show all the changes necessary to ensure that the Mouse and Chart Trade indicators do not break. As a bonus, we'll also cover other changes that have occurred in other header files that will be widely used in the future.
Unlike what was done in the previous article, here we will test the selection option using an Expert Advisor. Although this is not a final solution yet, it will be enough for now. With the help of this article, you will be able to understand how to implement one of the possible solutions.
The article considers a new population optimization algorithm - Cyclic Parthenogenesis Algorithm (CPA), inspired by the unique reproductive strategy of aphids. The algorithm combines two reproduction mechanisms — parthenogenesis and sexual reproduction — and also utilizes the colonial structure of the population with the possibility of migration between colonies. The key features of the algorithm are adaptive switching between different reproductive strategies and a system of information exchange between colonies through the flight mechanism.