Obviously the current metrics are very far from the ideal time for creating a 1-minute bar. That's the first thing we are going to fix. Fixing the synchronization problem is not difficult. This may seem hard, but it's actually quite simple. We did not make the required correction in the previous article since its purpose was to explain how to transfer the tick data that was used to create the 1-minute bars on the chart into the Market Watch window.
Dive into the fascinating realm of algorithmic trading with our beginner-friendly guide to MQL5 programming. Discover the essentials of MQL5, the language powering MetaTrader 5, as we demystify the world of automated trading. From understanding the basics to taking your first steps in coding, this article is your key to unlocking the potential of algorithmic trading even without a programming background. Join us on a journey where simplicity meets sophistication in the exciting universe of MQL5.
Here we will see how to implement something really interesting, but at the same time very difficult due to certain points that can be very confusing. The worst thing that can happen is that some traders who consider themselves professionals do not know anything about the importance of these concepts in the capital market. Well, although we focus here on programming, understanding some of the issues involved in market trading is paramount to what we are going to implement.
We need to organize our work better. The code is growing, and if this is not done now, then it will become impossible. Let's divide and conquer. MQL5 allows the use of classes which will assist in implementing this task, but for this we need to have some knowledge about classes. Probably the thing that confuses beginners the most is inheritance. In this article, we will look at how to use these mechanisms in a practical and simple way.
In this article we will complete the development of a simulator for our system. The main goal here will be to configure the algorithm discussed in the previous article. This algorithm aims to create a RANDOM WALK movement. Therefore, to understand today's material, it is necessary to understand the content of previous articles. If you have not followed the development of the simulator, I advise you to read this sequence from the very beginning. Otherwise, you may get confused about what will be explained here.
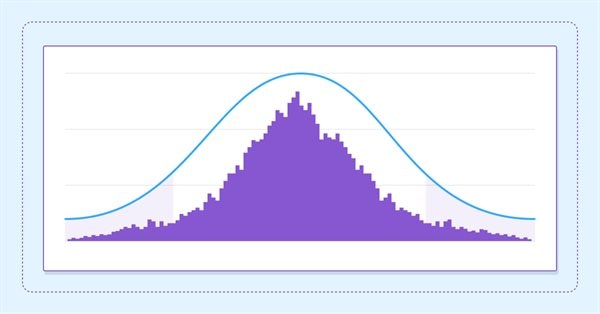
In this article we will continue the simulator development stage. this time we will see how to effectively create a RANDOM WALK type movement. This type of movement is very intriguing because it forms the basis of everything that happens in the capital market. In addition, we will begin to understand some concepts that are fundamental to those conducting market analysis.
Here we will simplify a few elements related to the work in the next article. I'll also explain how you can visualize what the simulator generates in terms of randomness.
Developing a simulator can be much more interesting than it seems. Today we'll take a few more steps in this direction because things are getting more interesting.
In order to use the data that forms the bars, we must abandon replay and start developing a simulator. We will use 1 minute bars because they offer the least amount of difficulty.
In this article we present an algorithm for permuting price bars and detail how permutation tests can be used to recognize instances where strategy performance has been fabricated to deceive potential buyers of Expert Advisors.
In this article, we will look at how to lock the indicator while simply using the MQL5 language, and we will do it in a very interesting and amazing way.
In the previous article, we made some fixes and added tests to our replication system to ensure the best possible stability. We also started creating and using a configuration file for this system.
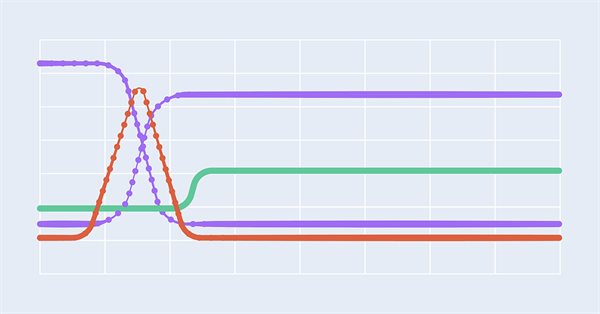
This article continues our series into category theory by introducing natural transformations, a key pillar within the subject. We look at the seemingly complex definition, then delve into examples and applications with this series’ ‘bread and butter’; volatility forecasting.
We have managed to develop a way to implement the market replay system in a realistic and accessible way. Now let's continue our project and add data to improve the replay behavior.
We all know the importance of the Moving Average indicator for a lot of traders. There are other Moving average types that can be useful in trading, we will identify these types in this article and make a simple comparison between each one of them and the most popular simple Moving average type to see which one can show the best results.
This article, the 16th in our series, continues with a look at Functors and how they can be implemented using artificial neural networks. We depart from our approach so far in the series, that has involved forecasting volatility and try to implement a custom signal class for setting position entry and exit signals.
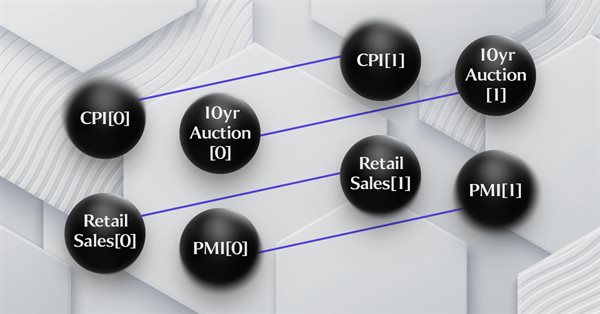
This article on Category Theory implementation in MQL5, continues the series by looking at Functors but this time as a bridge between Graphs and a set. We revisit calendar data, and despite its limitations in Strategy Tester use, make the case using functors in forecasting volatility with the help of correlation.
This article which is part of a broader series on Category Theory implementation in MQL5, delves into Functors. We examine how a Linear Order can be mapped to a set, thanks to Functors; by considering two sets of data that one would typically dismiss as having any connection.
This article, that follows Category Theory implementation of Orders in MQL5, considers how database schemas can be incorporated for classification in MQL5. We take an introductory look at how database schema concepts could be married with category theory when identifying trade relevant text(string) information. Calendar events are the focus.
How about creating a system that would allow us to study the market when it is closed or even to simulate market situations? Here we are going to start a new series of articles in which we will deal with this topic.
In this article, we will create a mathematical model for simulating multicurrency pricing and complete the study of the diversification principle as part of the search for mechanisms to increase the trading efficiency, which I started in the previous article with theoretical calculations.
The multilayer perceptron is an evolution of the simple perceptron which can solve non-linear separable problems. Together with the backpropagation algorithm, this neural network can be effectively trained. In Part 3 of the Multilayer Perceptron and Backpropagation series, we'll see how to integrate this technique into the Strategy Tester. This integration will allow the use of complex data analysis aimed at making better decisions to optimize your trading strategies. In this article, we will discuss the advantages and problems of this technique.
This article continues the series on category theory implementation in MQL5. Here we continue monoid-actions as a means of transforming monoids, covered in the previous article, leading to increased applications.
This article continues the series on category theory implementation in MQL5. Here we introduce monoids as domain (set) that sets category theory apart from other data classification methods by including rules and an identity element.
There is an essential need for MQL5 programmers or developers to master important and valuable tools. One of these tools is the Strategy Tester, this article is a practical guide to understanding and using the strategy tester of MQL5.
In this article, I will consider a simple template for creating a universal MetaTrader robot that can be used on multiple charts while being attached to only one chart, without the need to configure each instance of the robot on each individual chart.
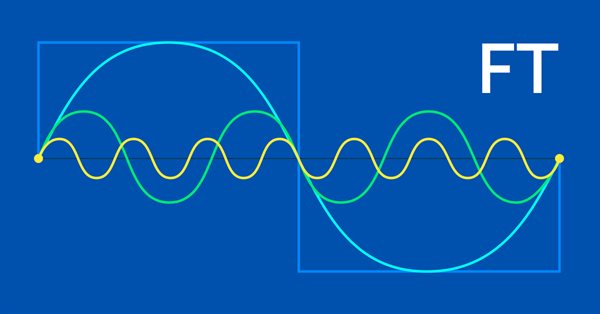
The Fourier transform introduced by Joseph Fourier is a means of deconstructing complex data wave points into simple constituent waves. This feature could be resourceful to traders and this article takes a look at that.
The article describes the principles, methods and possibilities of using the Electromagnetic Algorithm in various optimization problems. The EM algorithm is an efficient optimization tool capable of working with large amounts of data and multidimensional functions.
Category Theory is a diverse and expanding branch of Mathematics which is only recently getting some coverage in the MQL5 community. These series of articles look to explore and examine some of its concepts & axioms with the overall goal of establishing an open library that provides insight while also hopefully furthering the use of this remarkable field in Traders' strategy development.
Saplings Sowing and Growing up (SSG) algorithm is inspired by one of the most resilient organisms on the planet demonstrating outstanding capability for survival in a wide variety of conditions.
In this article, I will consider the Monkey Algorithm (MA) optimization algorithm. The ability of these animals to overcome difficult obstacles and get to the most inaccessible tree tops formed the basis of the idea of the MA algorithm.