The article describes the theory and practice of applying the backpropagation algorithm in MQL5 using matrices. It provides ready-made classes along with script, indicator and Expert Advisor examples.
Category Theory is a diverse and expanding branch of Mathematics which is only recently getting some coverage in the MQL5 community. These series of articles look to explore and examine some of its concepts & axioms with the overall goal of establishing an open library that provides insight while also hopefully furthering the use of this remarkable field in Traders' strategy development.
Category Theory is a diverse and expanding branch of Mathematics which as of yet is relatively uncovered in the MQL5 community. These series of articles look to introduce and examine some of its concepts with the overall goal of establishing an open library that provides insight while hopefully furthering the use of this remarkable field in Traders' strategy development.
This article tries to answer the question: how can we choose the right expert advisors? Which are the best for our portfolio, and how can we filter the large trading bots list available on the market? This article will present twenty clear and strong criteria to reject an expert advisor. Each criterion will be presented and well explained to help you make a more sustained decision and build a more profitable expert advisor collection for your profits.
Fish School Search (FSS) is a new optimization algorithm inspired by the behavior of fish in a school, most of which (up to 80%) swim in an organized community of relatives. It has been proven that fish aggregations play an important role in the efficiency of foraging and protection from predators.
The next algorithm I will consider is cuckoo search optimization using Levy flights. This is one of the latest optimization algorithms and a new leader in the leaderboard.
Let's consider one of the newest modern optimization algorithms - Grey Wolf Optimization. The original behavior on test functions makes this algorithm one of the most interesting among the ones considered earlier. This is one of the top algorithms for use in training neural networks, smooth functions with many variables.
In this article, we will study the algorithm of an artificial bee colony and supplement our knowledge with new principles of studying functional spaces. In this article, I will showcase my interpretation of the classic version of the algorithm.
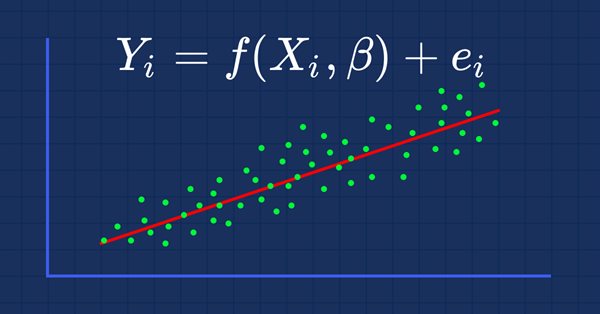
Markov chains are a powerful mathematical tool that can be used to model and forecast time series data in various fields, including finance. In financial time series modelling and forecasting, Markov chains are often used to model the evolution of financial assets over time, such as stock prices or exchange rates. One of the main advantages of Markov chain models is their simplicity and ease of use.
This time I will analyze the Ant Colony optimization algorithm. The algorithm is very interesting and complex. In the article, I make an attempt to create a new type of ACO.
What is Frames Analyzer? This is a plug-in module for any Expert Advisor for analyzing optimization frames during parameter optimization in the strategy tester, as well as outside the tester, by reading an MQD file or a database that is created immediately after parameter optimization. You will be able to share these optimization results with other users who have the Frames Analyzer tool to discuss the results together.
In this article, I will consider the popular Particle Swarm Optimization (PSO) algorithm. Previously, we discussed such important characteristics of optimization algorithms as convergence, convergence rate, stability, scalability, as well as developed a test stand and considered the simplest RNG algorithm.
In this article, I will show you how to calculate the total profit or loss of any trade, including commission and swap. I will provide the most accurate mathematical model and use it to write the code and compare it with the standard. Besides, I will also try to get on the inside of the main MQL5 function to calculate profit and get to the bottom of all the necessary values from the specification.
This is an introductory article on optimization algorithm (OA) classification. The article attempts to create a test stand (a set of functions), which is to be used for comparing OAs and, perhaps, identifying the most universal algorithm out of all widely known ones.
In this article, I will use experimentation and non-standard approaches to develop a profitable trading system and check whether neural networks can be of any help for traders. MetaTrader 5 as a self-sufficient tool for using neural networks in trading.
Todays trader is a philomath who is almost always looking up new ideas, trying them out, choosing to modify them or discard them; an exploratory process that should cost a fair amount of diligence. These series of articles will proposition that the MQL5 wizard should be a mainstay for traders.
In this article, I will use experimentation and non-standard approaches to develop a profitable trading system and check whether neural networks can be of any help for traders.
Todays trader is a philomath who is almost always (either consciously or not...) looking up new ideas, trying them out, choosing to modify them or discard them; an exploratory process that should cost a fair amount of diligence. This clearly places a premium on the trader's time and the need to avoid mistakes. These series of articles will proposition that the MQL5 wizard should be a mainstay for traders. Why? Because not only does the trader save time by assembling his new ideas with the MQL5 wizard, and greatly reduce mistakes from duplicate coding; he is ultimately set-up to channel his energy on the few critical areas of his trading philosophy.
In this article, we will consider some of the essential points you should pay attention to when purchasing an Expert Advisor. We will also look for ways to increase profit, to spend money wisely, and to earn from this spending. Also, after reading the article, you will see that it is possible to earn even using simple and free products.
In this article, we will consider how to build graphs of all optimization passes and to select the optimal custom criterion. We will also see how to create a desired solution with little MQL5 knowledge, using the articles published on the website and forum comments.
Determing the broker offset and GMT automatically. Instead of asking the support of your broker, from whom you will probably receive an insufficient answer (who would be willing to explain a missing hour), we simply look ourselves how they time their prices in the weeks of the time changes — but not cumbersome by hand, we let a program do it — why do we have a PC after all.
Functions and code snippets that simplify and clarify the handling of time, broker offset, and the changes to summer or winter time. Accurate timing may be a crucial element in trading. At the current hour, is the stock exchange in London or New York already open or not yet open, when does the trading time for Forex trading start and end? For a trader who trades manually and live, this is not a big problem.
In this series of article, we will try to find a practical application of probability theory to describe trading and pricing processes. In the first article, we will look into the basics of combinatorics and probability, and will analyze the first example of how to apply fractals in the framework of the probability theory.
The article presents an improved brute force version, based on the goals set in the previous article. I will try to cover this topic as broadly as possible using Expert Advisors with settings obtained using this method. A new program version is attached to this article.
In this article I will demonstrate some very interesting and useful techniques for automated trading. Some of them may be familiar to you. I will try to cover the most interesting methods and will explain why they are worth using. Furthermore, I will show what these techniques are apt to in practice. We will create Expert Advisors and test all the described techniques using historic quotes.
This article provides a continuation to the brute force topic, and it introduces new opportunities for market analysis into the program algorithm, thereby accelerating the speed of analysis and improving the quality of results. New additions enable the highest-quality view of global patterns within this approach.
In this article we will continue discussing the brute force approach. I will try to provide a better explanation of the pattern using the new improved version of my application. I will also try to find the difference in stability using different time intervals and timeframes.
In this article, we will search for market patterns, create Expert Advisors based on the identified patterns, and check how long these patterns remain valid, if they ever retain their validity.
The article describes a method of fast optimization using the particle swarm algorithm. It also presents the method implementation in MQL, which is ready for use both in single-threaded mode inside an Expert Advisor and in a parallel multi-threaded mode as an add-on that runs on local tester agents.
The program has been modified based on comments and requests from users and readers of this article series. This article contains a new version of the auto optimizer. This version implements requested features and provides other improvements, which I found when working with the program.
The article is devoted to the programmatic generation of custom symbols which are used to demonstrate some popular methods for displaying quotes. It describes a suggested variant of minimally invasive adaptation of Expert Advisors for trading a real symbol from a derived custom symbol chart. MQL source codes are attached to this article.
Training the CatBoost classifier in Python and exporting the model to mql5, as well as parsing the model parameters and a custom strategy tester. The Python language and the MetaTrader 5 library are used for preparing the data and for training the model.
The article provides a description and instructions for the practical use of neural network modules on the Matlab platform. It also covers the main aspects of creation of a trading system using the neural network module. In order to be able to introduce the complex within one article, I had to modify it so as to combine several neural network module functions in one program.
This article describes the connection of the graphical part of the auto optimizer program with its logical part. It considers the optimization launch process, from a button click to task redirection to the optimization manager.
We have previously considered the creation of automatic walk-forward optimization. This time, we will proceed to the internal structure of the auto optimizer tool. The article will be useful for all those who wish to further work with the created project and to modify it, as well as for those who wish to understand the program logic. The current article contains UML diagrams which present the internal structure of the project and the relationships between objects. It also describes the process of optimization start, but it does not contain the description of the optimizer implementation process.
This article provides further description of the walk-forward optimization in the MetaTrader 5 terminal. In previous articles, we considered methods for generating and filtering the optimization report and started analyzing the internal structure of the application responsible for the optimization process. The Auto Optimizer is implemented as a C# application and it has its own graphical interface. The fifth article is devoted to the creation of this graphical interface.
The main purpose of the article is to describe the mechanism of working with our application and its capabilities. Thus the article can be treated as an instruction on how to use the application. It covers all possible pitfalls and specifics of the application usage.
The third part serves as a bridge between the previous two parts: it describes the mechanism of interaction with the DLL considered in the first article and the objects for report downloading, which were described in the second article. We will analyze the process of wrapper creation for a class which is imported from DLL and which forms an XML file with the trading history. We will also consider a method for interacting with this wrapper.