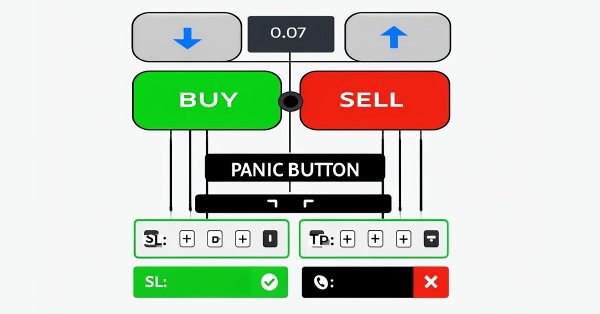
In this article, we design a custom MQL5 toolkit for easy manual backtesting in the Strategy Tester. We explain its design and implementation, focusing on interactive trade controls. We then show how to use it to test strategies effectively
Let's continue to automate the steps we previously performed manually. This time we will return to the automation of the second stage, that is, the selection of the optimal group of single instances of trading strategies, supplementing it with the ability to take into account the results of instances in the forward period.
In this article, we introduce a trade layering strategy that combines MACD and RSI indicators with statistical methods to automate dynamic trading in MQL5. We explore the architecture of this cascading approach, detail its implementation through key code segments, and guide readers on backtesting to optimize performance. Finally, we conclude by highlighting the strategy’s potential and setting the stage for further enhancements in automated trading.
We continue to study algorithms for extracting features from a point cloud. In this article, we will get acquainted with the mechanisms for increasing the efficiency of the PointNet method.
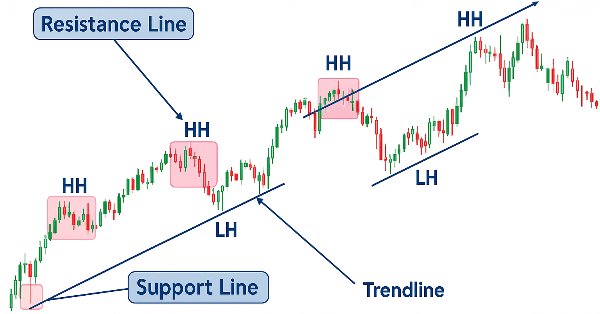
In this article, you'll learn how to build a price action indicator in MQL5, focusing on key points like low (L), high (H), higher low (HL), higher high (HH), lower low (LL), and lower high (LH) for analyzing trends. You'll also explore how to identify the premium and discount zones, mark the 50% retracement level, and use the risk-reward ratio to calculate profit targets. The article also covers determining entry points, stop loss (SL), and take profit (TP) levels based on the trend structure.
Depth of Market is undoubtedly a very important element for executing fast trades, especially in High Frequency Trading (HFT) algorithms. In this series of articles, we will look at this type of trading events that can be obtained through a broker on many tradable symbols. We will start with an indicator, where you can customize the color palette, position and size of the histogram displayed directly on the chart. We will also look at how to generate BookEvent events to test the indicator under certain conditions. Other possible topics for future articles include how to store price distribution data and how to use it in a strategy tester.
This article describes the fundamentals of portfolio-level statistical arbitrage. Its goal is to facilitate the understanding of the principles of statistical arbitrage to readers without deep math knowledge and propose a starting point conceptual framework. The article includes a working Expert Advisor, some notes about its one-year backtest, and the respective backtest configuration settings (.ini file) for the reproduction of the experiment.
The article is devoted to the metaheuristic Atmosphere Clouds Model Optimization (ACMO) algorithm, which simulates the behavior of clouds to solve optimization problems. The algorithm uses the principles of cloud generation, movement and propagation, adapting to the "weather conditions" in the solution space. The article reveals how the algorithm's meteorological simulation finds optimal solutions in a complex possibility space and describes in detail the stages of ACMO operation, including "sky" preparation, cloud birth, cloud movement, and rain concentration.
Direct point cloud analysis avoids unnecessary data growth and improves the performance of models in classification and segmentation tasks. Such approaches demonstrate high performance and robustness to perturbations in the original data.
Every price action trader manually uses trendlines to confirm trends and spot potential turning or continuation levels. In this series on developing a price action analysis toolkit, we introduce a tool focused on drawing slanted trendlines for easy market analysis. This tool simplifies the process for traders by clearly outlining key trends and levels essential for effective price action evaluation.
We continue studying the Hierarchical Vector Transformer method. In this article, we will complete the construction of the model. We will also train and test it on real historical data.
We continue our last article on DDPG with MA and stochastic indicators by examining other key Reinforcement Learning classes crucial for implementing DDPG. Though we are mostly coding in python, the final product, of a trained network will be exported to as an ONNX to MQL5 where we integrate it as a resource in a wizard assembled Expert Advisor.
Discover practical techniques to optimize memory usage in MQL5 trading systems. Learn to build efficient, stable, and fast-performing Expert Advisors and indicators. We’ll explore how memory really works in MQL5, the common traps that slow your systems down or cause them to fail, and — most importantly — how to fix them.
The article takes a detailed look at the archery-inspired optimization algorithm, with an emphasis on using the roulette method as a mechanism for selecting promising areas for "arrows". The method allows evaluating the quality of solutions and selecting the most promising positions for further study.
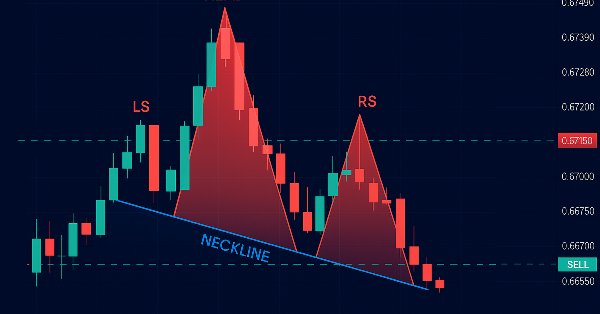
In this article, we automate the Head and Shoulders pattern in MQL5. We analyze its architecture, implement an EA to detect and trade it, and backtest the results. The process reveals a practical trading algorithm with room for refinement.
Larry Connors is a renowned trader and author, best known for his work in quantitative trading and strategies like the 2-period RSI (RSI2), which helps identify short-term overbought and oversold market conditions. In this article, we’ll first explain the motivation behind our research, then recreate three of Connors’ most famous strategies in MQL5 and apply them to intraday trading of the S&P 500 index CFD.
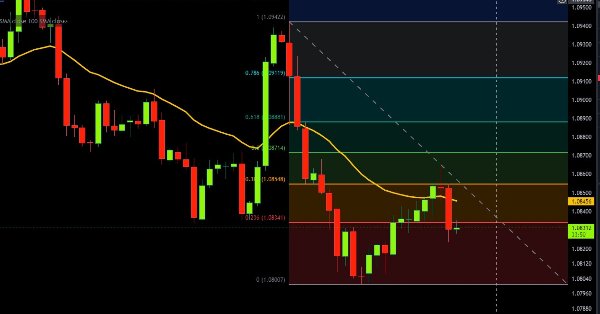
Learn to build a Harmonic Pattern indicator in MQL5 using chart objects. Discover how to detect swing points, apply Fibonacci retracements, and automate pattern recognition.
This article explores optimizing RSI levels and periods for better trading signals. We introduce methods to estimate optimal RSI values and automate period selection using grid search and statistical models. Finally, we implement the solution in MQL5 while leveraging Python for analysis. Our approach aims to be pragmatic and straightforward to help you solve potentially complicated problems, with simplicity.
We invite you to get acquainted with the Hierarchical Vector Transformer (HiVT) method, which was developed for fast and accurate forecasting of multimodal time series.
In this article, we build an MQL5 trading system that automates order block detection for Smart Money trading. We outline the strategy’s rules, implement the logic in MQL5, and integrate risk management for effective trade execution. Finally, we backtest the system to assess its performance and refine it for optimal results.
Understanding agent behavior is important in many different areas, but most methods focus on just one of the tasks (understanding, noise removal, or prediction), which reduces their effectiveness in real-world scenarios. In this article, we will get acquainted with a model that can adapt to solving various problems.
In this article, we will look at changes that will allow the replay/simulation system to operate more efficiently and securely. I will also not leave without attention those who want to get the most out of using classes. In addition, we will consider a specific problem in MQL5 that reduces code performance when working with classes, and explain how to solve it.
The Darvas Box Breakout Strategy, created by Nicolas Darvas, is a technical trading approach that spots potential buy signals when a stock’s price rises above a set "box" range, suggesting strong upward momentum. In this article, we will apply this strategy concept as an example to explore three advanced machine learning techniques. These include using a machine learning model to generate signals rather than to filter trades, employing continuous signals rather than discrete ones, and using models trained on different timeframes to confirm trades.
Moving Average and Stochastic Oscillator are very common indicators that some traders may not use a lot because of their lagging nature. In a 3-part ‘miniseries' that considers the 3 main forms of machine learning, we look to see if this bias against these indicators is justified, or they might be holding an edge. We do our examination in wizard assembled Expert Advisors.
As a price action observer and trader, I've noticed that when a trend is confirmed by multiple timeframes, it usually continues in that direction. What may vary is how long the trend lasts, and this depends on the type of trader you are, whether you hold positions for the long term or engage in scalping. The timeframes you choose for confirmation play a crucial role. Check out this article for a quick, automated system that helps you analyze the overall trend across different timeframes with just a button click or regular updates.
Currently, our EA uses the database to obtain initialization strings for single instances of trading strategies. However, the database is quite large and contains a lot of information that is not needed for the actual EA operation. Let's try to ensure the EA's functionality without a mandatory connection to the database.
In this article, I would like to introduce you to an interesting trajectory prediction method developed to solve problems in the field of autonomous vehicle movements. The authors of the method combined the best elements of various architectural solutions.
In this article, we develop a multi-level grid trading system EA using MQL5, focusing on the architecture and algorithm design behind grid trading strategies. We explore the implementation of multi-layered grid logic and risk management techniques to handle varying market conditions. Finally, we provide detailed explanations and practical tips to guide you through building, testing, and refining the automated trading system.
A large number of the models we have reviewed so far are based on the Transformer architecture. However, they may be inefficient when dealing with long sequences. And in this article, we will get acquainted with an alternative direction of time series forecasting based on state space models.
In our previous article, we introduced a simple script called "The Quarters Drawer." Building on that foundation, we are now taking the next step by creating a monitor Expert Advisor (EA) to track these quarters and provide oversight regarding potential market reactions at these levels. Join us as we explore the process of developing a zone detection tool in this article.
Discover how to effortlessly import and utilize the History Manager EX5 library in your MQL5 source code to process trade histories in your MetaTrader 5 account in this series' final article. With simple one-line function calls in MQL5, you can efficiently manage and analyze your trading data. Additionally, you will learn how to create different trade history analytics scripts and develop a price-based Expert Advisor as practical use-case examples. The example EA leverages price data and the History Manager EX5 library to make informed trading decisions, adjust trade volumes, and implement recovery strategies based on previously closed trades.
Traders often face drawdowns from false signals, while waiting for confirmation can lead to missed opportunities. This article introduces a triangular trading strategy using Silver’s pricing in Dollars (XAGUSD) and Euros (XAGEUR), along with the EURUSD exchange rate, to filter out noise. By leveraging cross-market relationships, traders can uncover hidden sentiment and refine their entries in real time.
The Fractals by Bill Williams is a potent indicator that is easy to overlook when one initially spots it on a price chart. It appears too busy and probably not incisive enough. We aim to draw away this curtain on this indicator by examining what its various patterns could accomplish when examined with forward walk tests on all, with wizard assembled Expert Advisor.
In this article, we develop an Expert Advisor in MQL5 for the Trend Flat Momentum Strategy. We combine a two moving averages crossover with RSI and CCI momentum filters to generate trade signals. We also cover backtesting and potential enhancements for real-world performance.
The Kalman filter is a recursive algorithm used in algorithmic trading to estimate the true state of a financial time series by filtering out noise from price movements. It dynamically updates predictions based on new market data, making it valuable for adaptive strategies like mean reversion. This article first introduces the Kalman filter, covering its calculation and implementation. Next, we apply the filter to a classic mean-reversion forex strategy as an example. Finally, we conduct various statistical analyses by comparing the filter with a moving average across different forex pairs.
We will create an indicator based on the Gann's Square of 9, built by squaring time and price. We will prepare the code and test the indicator in the platform on different time intervals.
Points of support and resistance are critical levels that signal potential trend reversals and continuations. Although identifying these levels can be challenging, once you pinpoint them, you’re well-prepared to navigate the market. For further assistance, check out the Quarters Drawer tool featured in this article, it will help you identify both primary and minor support and resistance levels.
In this article, we implement automated trade entry using the MQL5 Economic Calendar by applying user-defined filters and time offsets to identify qualifying news events. We compare forecast and previous values to determine whether to open a BUY or SELL trade. Dynamic countdown timers display the remaining time until news release and reset automatically after a trade.
In this article, we build an Expert Advisor in MQL5 for the Asian Breakout Strategy by calculating the session's high and low and applying trend filtering with a moving average. We implement dynamic object styling, user-defined time inputs, and robust risk management. Finally, we demonstrate backtesting and optimization techniques to refine the program.
In this article, we build an MQL5 Expert Advisor to detect Butterfly harmonic patterns. We identify pivot points and validate Fibonacci levels to confirm the pattern. We then visualize the pattern on the chart and automatically execute trades when confirmed.